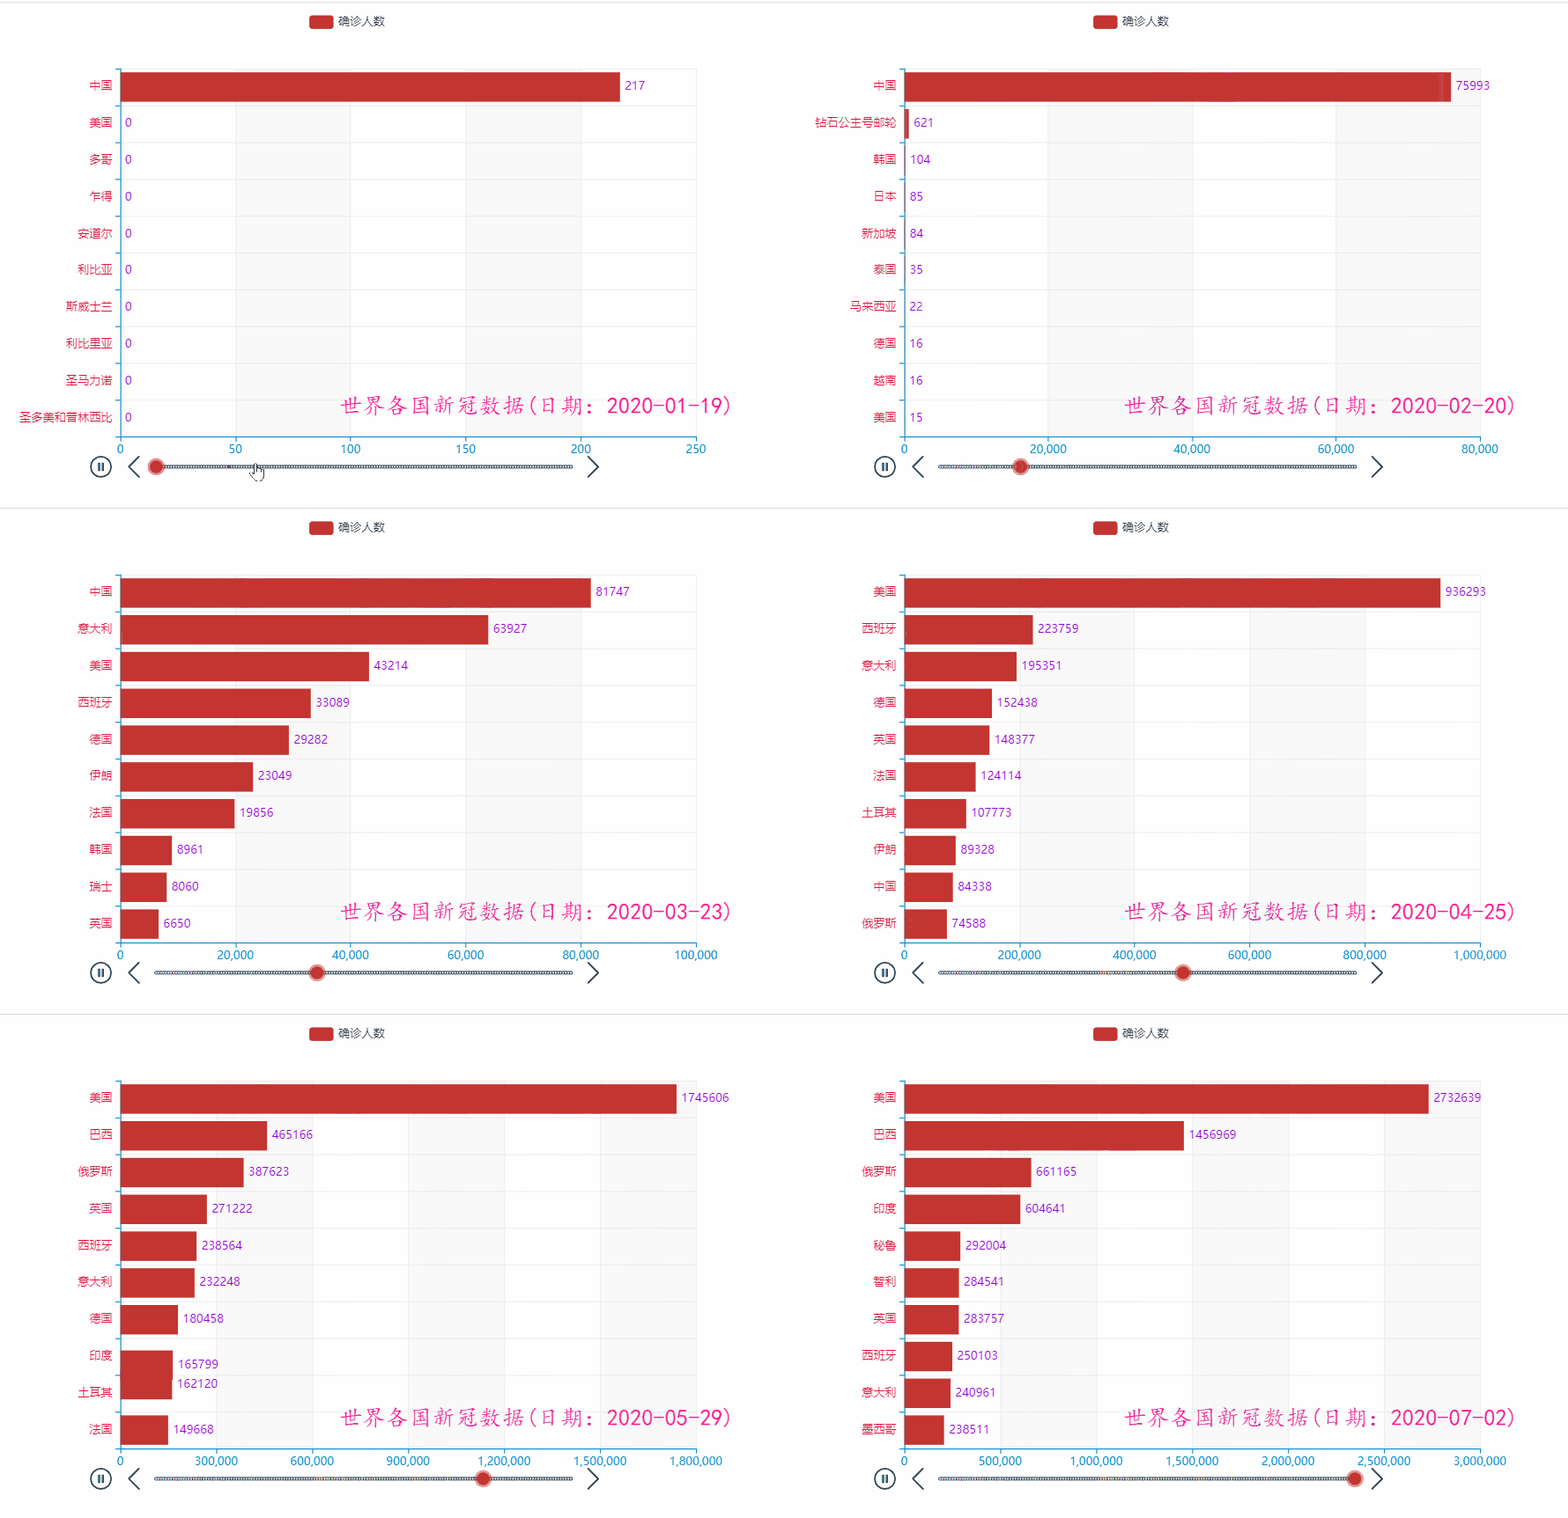
2020年因为新冠疫情而变得特别,我们会看到很多网站都提供了多种疫情统计图,今天我们使用 Python 的 pyecharts 框架来绘制一些比较常见的统计图。
本项目源码已上传至gitee: 项目地址
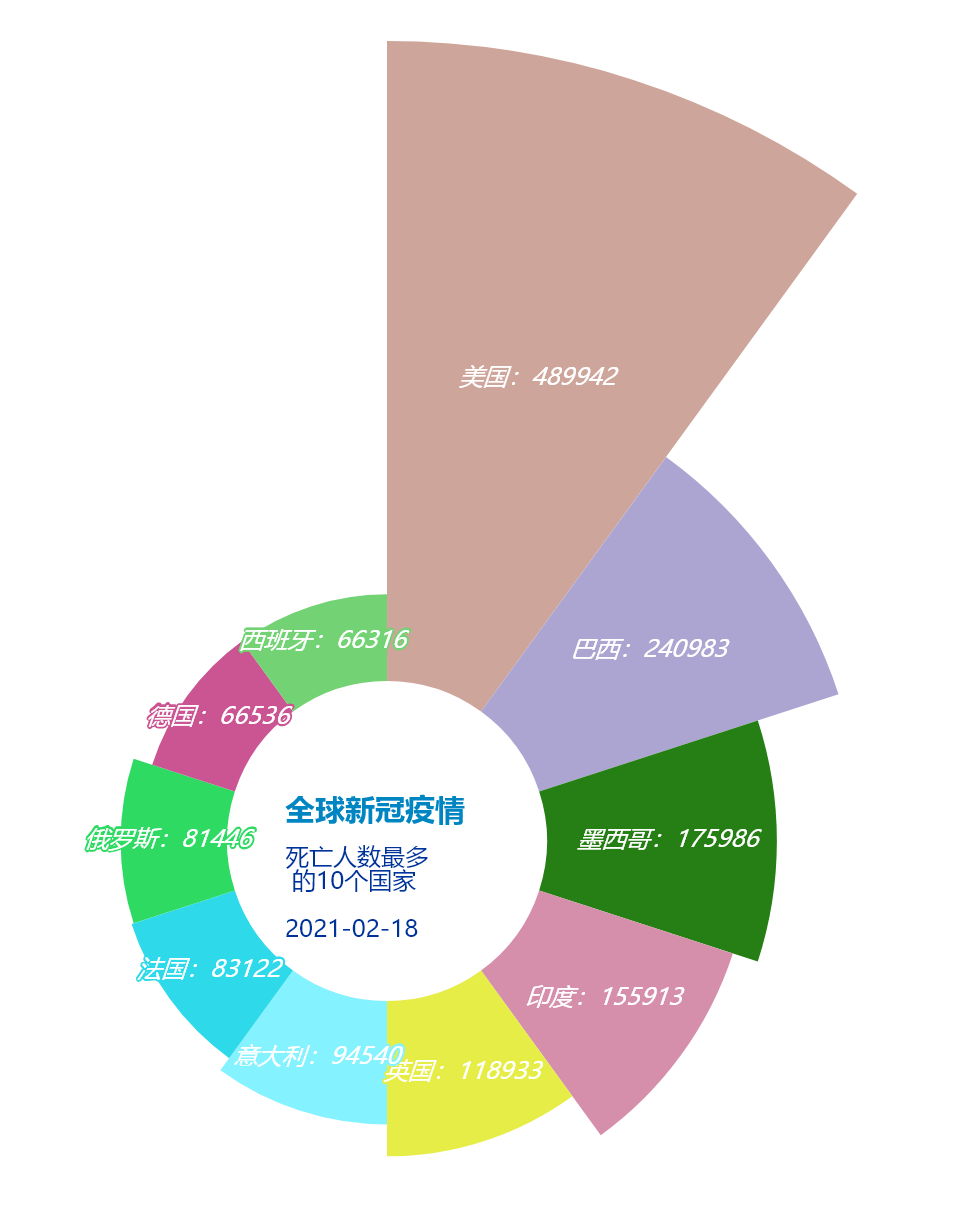
一、玫瑰图
首先,我们来绘制前段时间比较火的南丁格尔玫瑰图,数据来源我们通过接口 https://lab.isaaclin.cn/nCoV/zh 来获取,我们取疫情中死亡人数超过 2000 的国家的数据,实现代码如下:
import datetime
import logging
import random

import requests
from pyecharts import options as opts
from pyecharts.charts import Pie
# 导入输出图片工具
from pyecharts.render import make_snapshot
# 使用snapshot-selenium 渲染图片
from snapshot_selenium import snapshot


logging.basicConfig(level=logging.INFO, format='%(asctime)s - %(levelname)s: %(message)s')


def plot_rose_pie(out_type: str = 'html', filename: str = 'epidemic_rose_pie'):
    url = 'https://lab.isaaclin.cn/nCoV/api/area'
    data_json = requests.get(url).json()
    logging.info('get response success, processing plot data...')
    data = {}
    for item in data_json['results']:
        if item['countryEnglishName']:
            if item['deadCount'] is not None and item['countryName'] is not None:
                data[item['countryName']] = item['deadCount']

    data = dict(sorted(data.items(), key=lambda k: k[1], reverse=True))

    # 名称有重复的,把国家名作为 key 吧
    country_list = list(data.keys())[:10]
    count_list = list(data.values())[:10]
    logging.info('data processing completed, ready to draw...')

    # 随机颜色生成
    def randomcolor(kind):
        colors = []
        for i in range(kind):
            colArr = ['1', '2', '3', '4', '5', '6', '7', '8', '9', 'A', 'B', 'C', 'D', 'E', 'F']
            color = ""
            for i in range(6):
                color += colArr[random.randint(0, 14)]
            colors.append("#" + color)
        return colors


    color_series = randomcolor(len(count_list))
    # 创建饼图
    pie = Pie(init_opts=opts.InitOpts(width='800px', height='900px'))
    # 添加数据
    pie.add("", [list(z) for z in zip(country_list, count_list)],
            radius=['20%', '100%'],
            center=['60%', '65%'],
            rosetype='area')
    # 设置全局配置
    # pie.set_global_opts(title_opts=opts.TitleOpts(title='南丁格尔玫瑰图'),
    #                     legend_opts=opts.LegendOpts(is_show=False))
    # 设置全局配置项
    date = datetime.datetime.now().strftime('%Y-%m-%d')
    pie.set_global_opts(title_opts=opts.TitleOpts(title='全球新冠疫情', subtitle=f'死亡人数最多\n 的10个国家\n\n{date}',
                                                  title_textstyle_opts=opts.TextStyleOpts(font_size=15, color='#0085c3'),
                                                  subtitle_textstyle_opts=opts.TextStyleOpts(font_size=12, color='#003399'),
                                                  pos_right='center', pos_left='53%', pos_top='62%', pos_bottom='center'
                                                  ),
                        legend_opts=opts.LegendOpts(is_show=False))
    # 设置系列配置和颜色
    pie.set_series_opts(label_opts=opts.LabelOpts(is_show=True, position='inside', font_size=12,
                                                  formatter='{b}:{c}', font_style='italic',
                                                  font_family='Microsoft YaHei'))
    pie.set_colors(color_series)
    filename = filename.split('.')[0]
    if out_type == 'html':
        pie.render(f'{filename}.html')
    else:
        make_snapshot(snapshot, pie.render(), f'{filename}.{out_type}')
    logging.info(f'{filename}.{out_type} saved success...')


if __name__ == '__main__':
    plot_rose_pie(filename='epidemic_rose_pie')
    # plot_rose_pie(out_type='png', filename='epidemic_rose_pie')
运行
2021-02-18 10:40:21,889 - INFO: get response success, processing plot data...
2021-02-18 10:40:21,890 - INFO: data processing completed, ready to draw...
2021-02-18 10:40:38,487 - INFO: epidemic_rose_pie.html saved success...
效果图
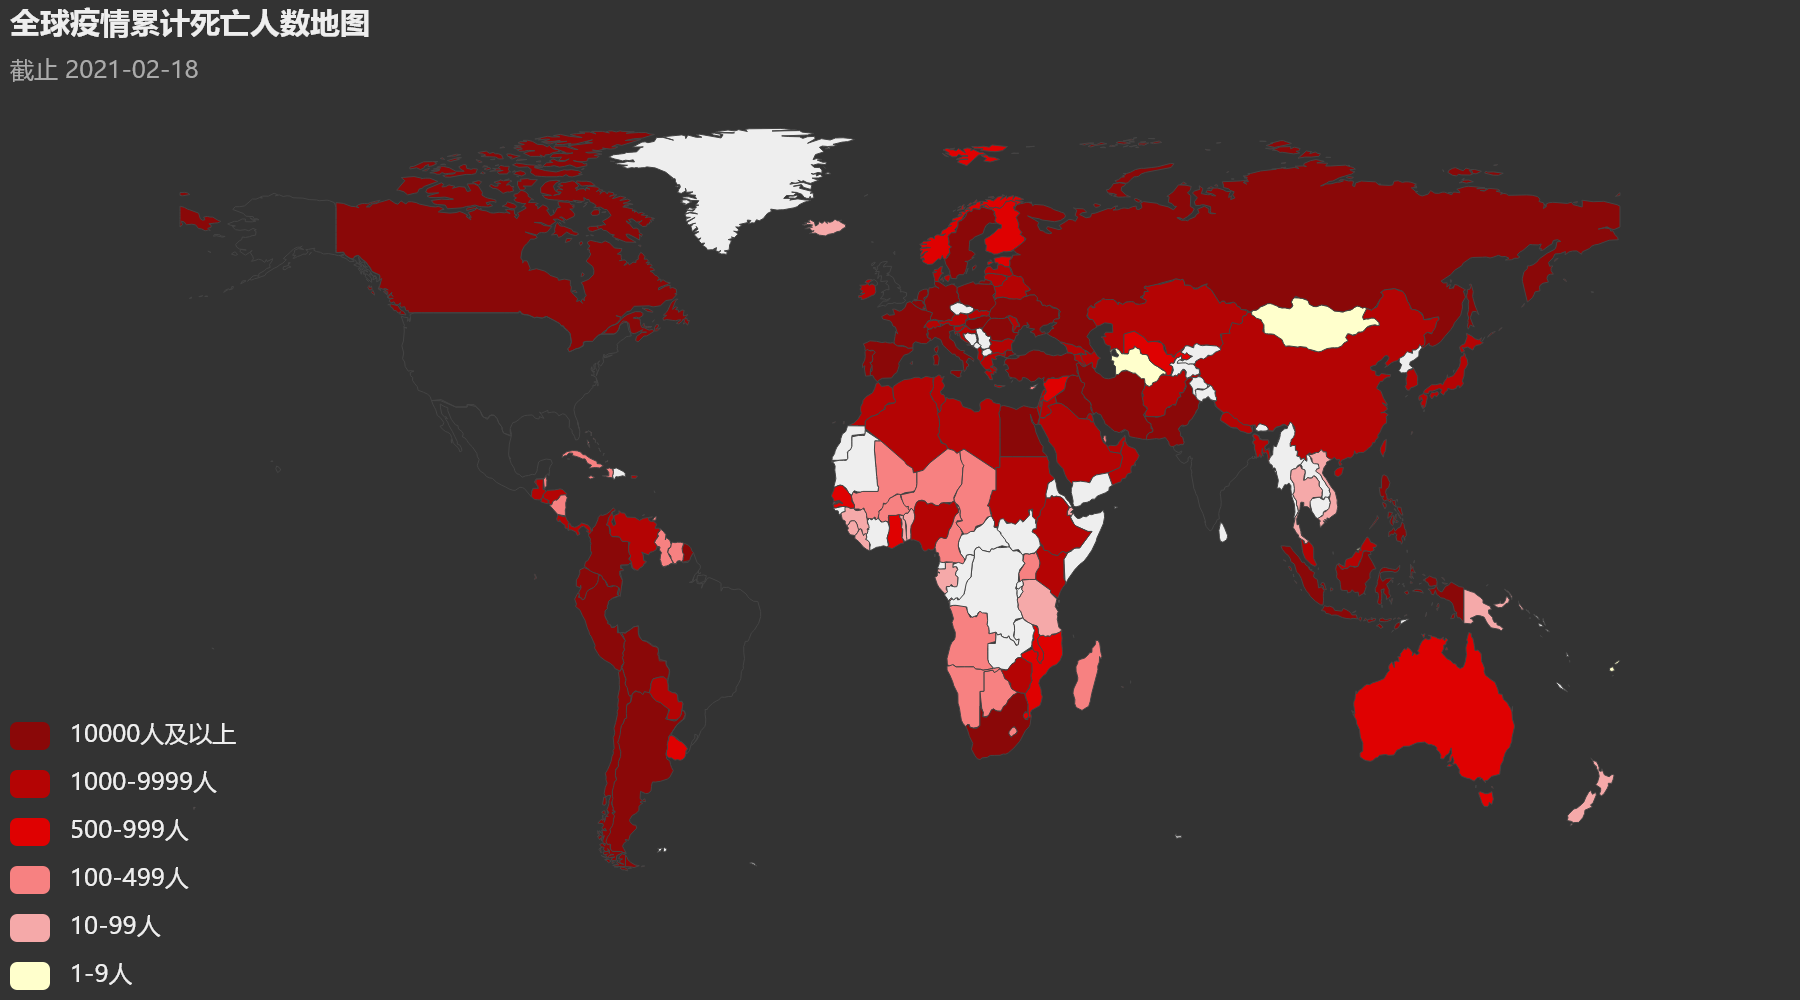
二、全球疫情地图
接着我们来绘制全球疫情地图,我们取各个国家的累计死亡人数的数据,代码实现如下所示:
import datetime
import logging

import requests
from pyecharts import options as opts
from pyecharts.charts import Map
# 导入输出图片工具
from pyecharts.render import make_snapshot
# 使用snapshot-selenium 渲染图片
from snapshot_selenium import snapshot

logging.basicConfig(level=logging.INFO, format='%(asctime)s - %(levelname)s: %(message)s')


def plot_world_map(out_type: str = 'html', filename: str = 'world_epidemic_map'):
    url = 'https://lab.isaaclin.cn/nCoV/api/area'
    data = requests.get(url).json()
    logging.info('get response success, processing data...')
    oversea_confirm = []
    for item in data['results']:
        if item['countryEnglishName']:
            oversea_confirm.append((item['countryEnglishName']
                                    .replace('United States of America', 'United States')
                                    .replace('United Kiongdom', 'United Kingdom'),
                                    item['deadCount']))
    logging.info('data processing completed, ready to draw...')
    date = datetime.datetime.now().strftime('%Y-%m-%d')
    world_map = (
        Map(init_opts=opts.InitOpts(theme='dark'))
            .add('累计死亡人数', oversea_confirm, 'world', is_map_symbol_show=False, is_roam=False)
            .set_series_opts(label_opts=opts.LabelOpts(is_show=False, color='#fff'))
            .set_global_opts(
            title_opts=opts.TitleOpts(title=f'全球疫情累计死亡人数地图', subtitle=f'截止 {date}',
                                      title_textstyle_opts=opts.TextStyleOpts(font_size=15),
                                      subtitle_textstyle_opts=opts.TextStyleOpts(font_size=12)),
            legend_opts=opts.LegendOpts(is_show=False),
            visualmap_opts=opts.VisualMapOpts(max_=2700,
                                              is_piecewise=True,
                                              pieces=[
                                                  {"max": 99999, "min": 10000, "label": "10000人及以上",
                                                   "color": "#8A0808"},
                                                  {"max": 9999, "min": 1000, "label": "1000-9999人", "color": "#B40404"},
                                                  {"max": 999, "min": 500, "label": "500-999人", "color": "#DF0101"},
                                                  {"max": 499, "min": 100, "label": "100-499人", "color": "#F78181"},
                                                  {"max": 99, "min": 10, "label": "10-99人", "color": "#F5A9A9"},
                                                  {"max": 9, "min": 0, "label": "1-9人", "color": "#FFFFCC"},
                                              ])
        )
    )
    if out_type == 'html':
        world_map.render(f'{filename}.html')
    else:
        make_snapshot(snapshot, world_map.render(), f'{filename}.{out_type}')
    logging.info(f'{filename}.{out_type} saved success...')


if __name__ == '__main__':
    plot_world_map()
    # plot_world_map(out_type='png')
运行
2021-02-18 11:04:46,447 - INFO: get response success, processing data...
2021-02-18 11:04:46,448 - INFO: data processing completed, ready to draw...
2021-02-18 11:04:46,504 - INFO: world_epidemic_map.html saved success...
效果图
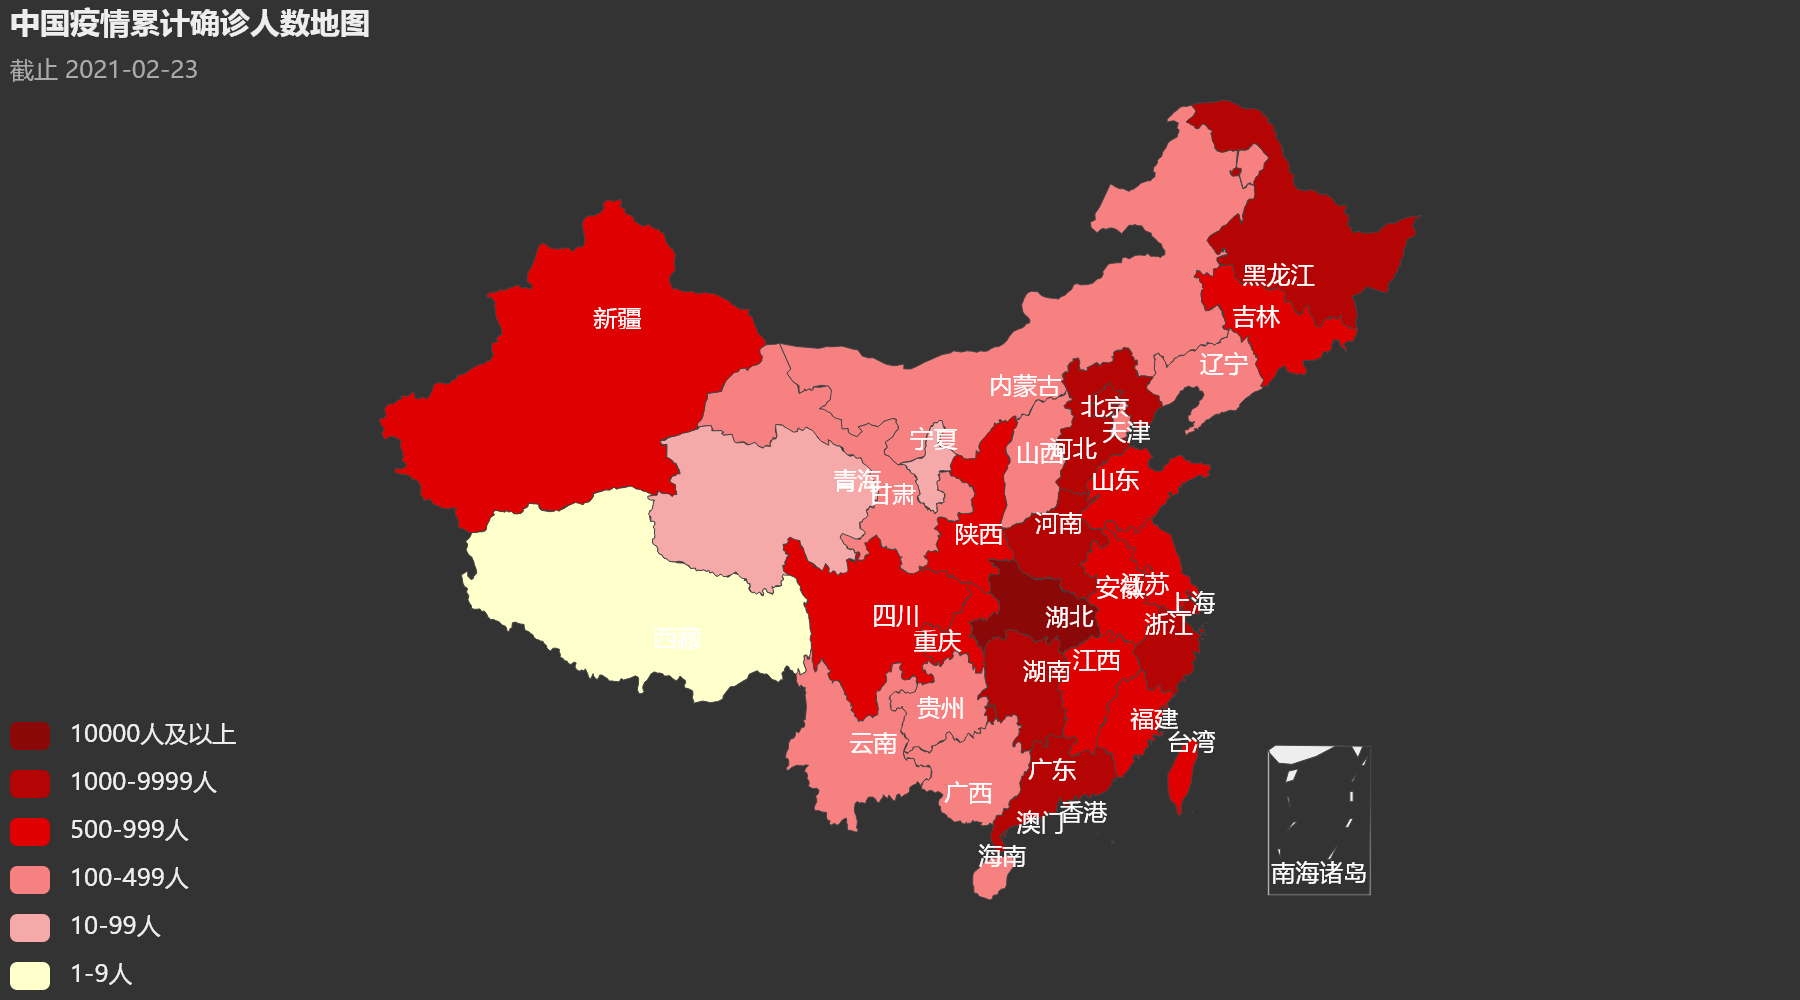
三、中国疫情地图
我们接着绘制我国的疫情地图,数据取各个省份累计确诊人数的数据,代码实现如下所示:
import datetime
import logging

import requests
from pyecharts import options as opts
from pyecharts.charts import Map
# 导入输出图片工具
from pyecharts.render import make_snapshot
# 使用snapshot-selenium 渲染图片
from snapshot_selenium import snapshot

logging.basicConfig(level=logging.INFO, format='%(asctime)s - %(levelname)s: %(message)s')


def plot_china_map(out_type: str = 'html', filename: str = 'china_epidemic_map'):
    url = 'https://lab.isaaclin.cn/nCoV/api/area'
    data = requests.get(url).json()
    logging.info('get response success, processing data...')
    province_data = []
    for item in data['results']:
        if item['countryName'] == '中国':
            province_data.append((item['provinceShortName'], item['confirmedCount']))

    logging.info('data processing completed, ready to draw...')
    date = datetime.datetime.now().strftime('%Y-%m-%d')

    china_map = (
        Map(init_opts=opts.InitOpts(theme='dark'))
            .add('确诊人数', province_data, 'china', is_map_symbol_show=False, is_roam=False)
            .set_series_opts(label_opts=opts.LabelOpts(is_show=True, color='#ffffff'))
            .set_global_opts(
            title_opts=opts.TitleOpts(title="中国疫情累计确诊人数地图", subtitle=f'截止 {date}',
                                      title_textstyle_opts=opts.TextStyleOpts(font_size=15),
                                      subtitle_textstyle_opts=opts.TextStyleOpts(font_size=12)),
            legend_opts=opts.LegendOpts(is_show=False),
            visualmap_opts=opts.VisualMapOpts(max_=2000,
                                              is_piecewise=True,
                                              pieces=[
                                                  {"max": 99999, "min": 10000, "label": "10000人及以上", "color": "#8A0808"},
                                                  {"max": 9999, "min": 1000, "label": "1000-9999人", "color": "#B40404"},
                                                  {"max": 999, "min": 500, "label": "500-999人", "color": "#DF0101"},
                                                  {"max": 499, "min": 100, "label": "100-499人", "color": "#F78181"},
                                                  {"max": 99, "min": 10, "label": "10-99人", "color": "#F5A9A9"},
                                                  {"max": 9, "min": 0, "label": "1-9人", "color": "#FFFFCC"},
                                              ])
        )
    )
    if out_type == 'html':
        china_map.render(f'{filename}.html')
    else:
        make_snapshot(snapshot, china_map.render(f'{filename}.html'), f'{filename}.{out_type}')
    logging.info(f'{filename}.{out_type} saved success...')


if __name__ == '__main__':
    # plot_china_map()
    plot_china_map(out_type='png')
效果图
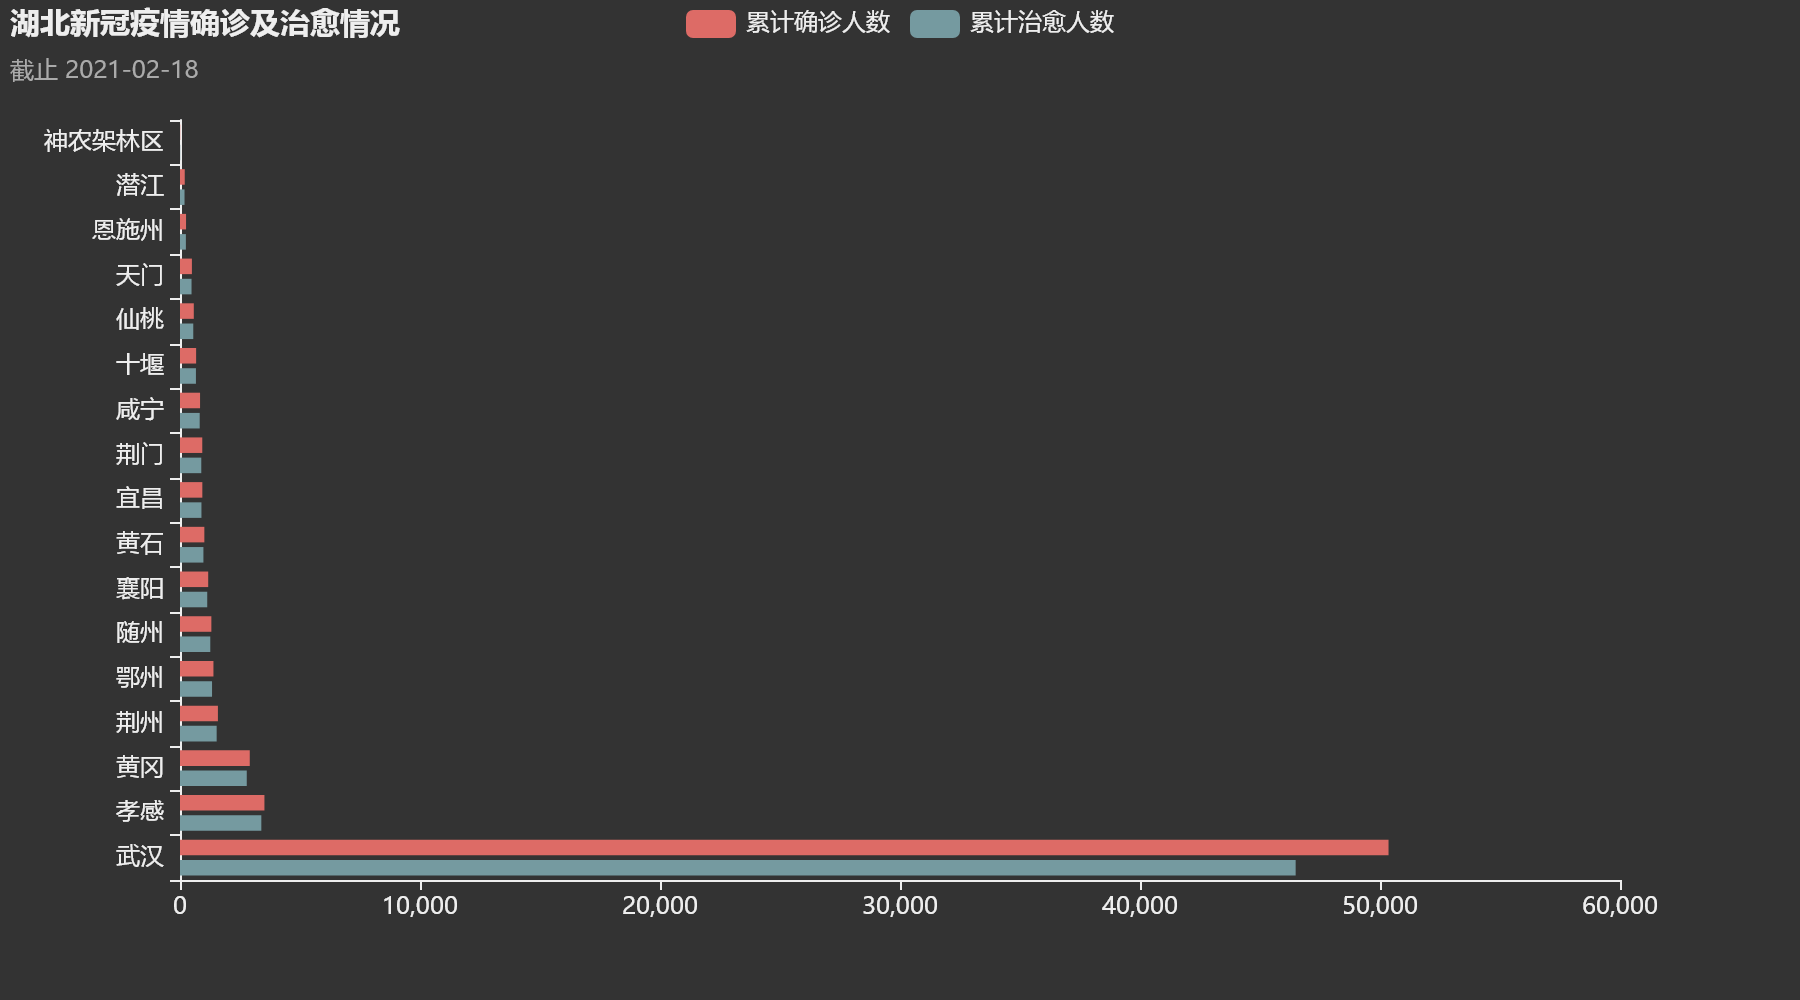
四、柱状图
我们接着来绘制柱状图,这次我们取一个省份的数据,因为湖北省确诊人数最多,我们就用这个省的数据吧,实现代码如下所示:
import datetime
import logging

import requests
from pyecharts import options as opts
from pyecharts.charts import Bar
# 导入输出图片工具
from pyecharts.render import make_snapshot
# 使用snapshot-selenium 渲染图片
from snapshot_selenium import snapshot

logging.basicConfig(level=logging.INFO, format='%(asctime)s - %(levelname)s: %(message)s')


def plot_hubei_bar(out_type: str = 'html', filename: str = 'hubei_epidemic_bar'):
    url = 'https://lab.isaaclin.cn/nCoV/api/area'
    data = requests.get(url).json()
    logging.info('get response success, processing data...')
    hb_data = {}
    for item in data['results']:
        if item['provinceShortName'] == '湖北':
            hb_data = item['cities']
    logging.info('data processing completed, ready to draw...')
    date = datetime.datetime.now().strftime('%Y-%m-%d')
    hb_bar = (
        Bar(init_opts=opts.InitOpts(theme='dark'))
            .add_xaxis([hd['cityName'] for hd in hb_data])
            .add_yaxis('累计确诊人数', [hd['confirmedCount'] for hd in hb_data])
            .add_yaxis('累计治愈人数', [hd['curedCount'] for hd in hb_data])
            .reversal_axis()
            .set_series_opts(label_opts=opts.LabelOpts(is_show=False))
            .set_global_opts(
            title_opts=opts.TitleOpts(title="湖北新冠疫情确诊及治愈情况", subtitle=f'截止 {date}',
                                      title_textstyle_opts=opts.TextStyleOpts(font_size=15),
                                      subtitle_textstyle_opts=opts.TextStyleOpts(font_size=12)),
            legend_opts=opts.LegendOpts(is_show=True)
        )
    )
    if out_type == 'html':
        hb_bar.render(f'{filename}.html')
    else:
        make_snapshot(snapshot, hb_bar.render(f'{filename}.html'), f'{filename}.{out_type}')
    logging.info(f'{filename}.{out_type} saved success...')


if __name__ == '__main__':
    # plot_hubei_bar()
    plot_hubei_bar(out_type='png')
效果图
五、折线图
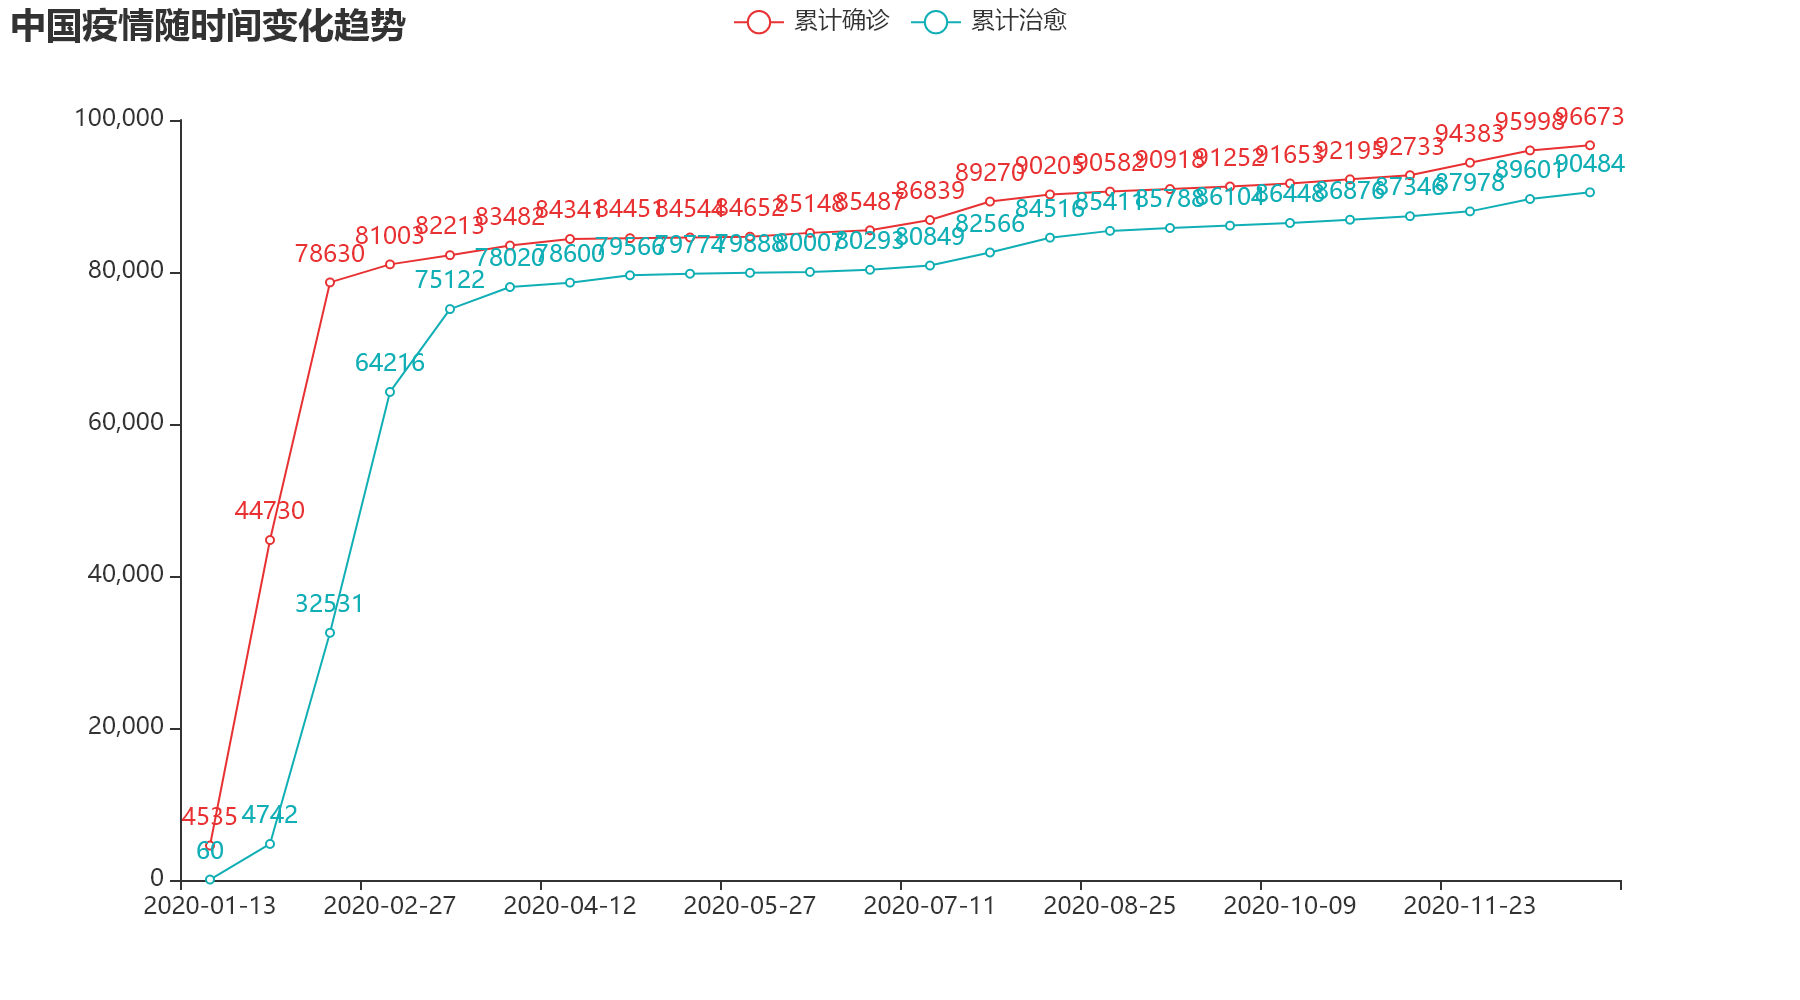
代码实现如下所示:
import logging

import pandas as pd
from pyecharts import options as opts
from pyecharts.charts import Line
# 导入输出图片工具
from pyecharts.render import make_snapshot
# 使用snapshot-selenium 渲染图片
from snapshot_selenium import snapshot

logging.basicConfig(level=logging.INFO, format='%(asctime)s - %(levelname)s: %(message)s')


def plot_china_line(out_type: str = 'html', filename: str = 'china_epidemic_line'):
    df = pd.read_excel('data/china_history.xlsx', index_col='date', date_parser='date')
    df = df.resample('15d').max()
    date = df.index.strftime('%Y-%m-%d').to_list()
    confirm = df['confirm'].to_list()
    heal = df['heal'].to_list()

    logging.info('data read completed, ready to draw...')
    line = (Line()
        .add_xaxis(date)
        .add_yaxis('累计确诊', confirm, color='#10aeb5')
        .add_yaxis('累计治愈', heal, color='#e83132')
        .set_series_opts(label_opts=opts.LabelOpts(is_show=True))
        .set_global_opts(
        title_opts=opts.TitleOpts(title='中国疫情随时间变化趋势')
    ))
    if out_type == 'html':
        line.render(f'{filename}.html')
    else:
        make_snapshot(snapshot, line.render(f'{filename}.html'), f'{filename}.{out_type}')
    logging.info(f'{filename}.{out_type} saved success...')


if __name__ == '__main__':
    plot_china_line(out_type='png')
效果图
六、全国各省市疫情数据动态图
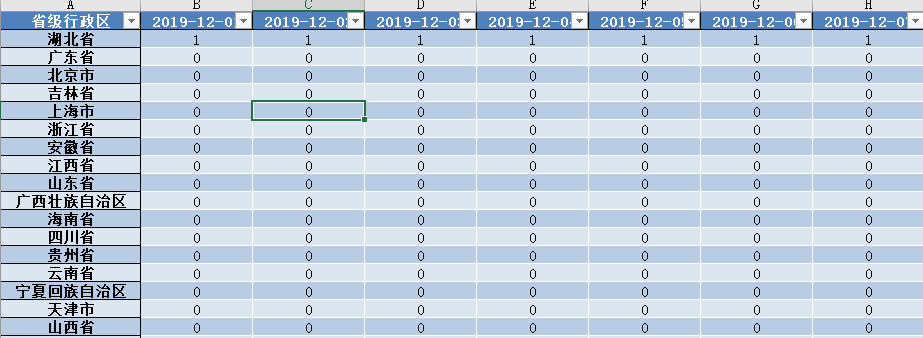
数据
代码
import pandas as pd
from pyecharts import options as opts
from pyecharts.charts import Bar, Timeline, Grid
from pyecharts.globals import ThemeType, CurrentConfig

CurrentConfig.ONLINE_HOST = "https://cdn.kesci.com/lib/pyecharts_assets/"

def plot(file: str, name_col: str, title: str, num: int = 10, duration=1.0, html_path: str = 'render.html'):
    df = pd.read_excel(file, index_col=name_col)
    date_list = df.columns.to_list()

    t = Timeline(init_opts=opts.InitOpts(theme=ThemeType.MACARONS))  # 定制主题
    for date in date_list:
        data = df.sort_values(date, ascending=False)[:num][::-1]

        x = data.index.to_list()
        y = data[date].to_list()

        bar = (
            Bar()
                .add_xaxis(x)  # x轴数据
                .add_yaxis('确诊人数', y)  # y轴数据
                .reversal_axis()  # 翻转
                .set_global_opts(  # 全局配置项
                title_opts=opts.TitleOpts(  # 标题配置项
                    title=f'{title}(日期:{date})',
                    pos_right="5%", pos_bottom="15%",
                    title_textstyle_opts=opts.TextStyleOpts(
                        font_family='KaiTi', font_size=24, color='#FF1493'
                    )
                ),
                xaxis_opts=opts.AxisOpts(  # x轴配置项
                    splitline_opts=opts.SplitLineOpts(is_show=True),
                ),
                yaxis_opts=opts.AxisOpts(  # y轴配置项
                    splitline_opts=opts.SplitLineOpts(is_show=True),
                    axislabel_opts=opts.LabelOpts(color='#DC143C')
                )
            )
                .set_series_opts(  # 系列配置项
                label_opts=opts.LabelOpts(  # 标签配置
                    position="right", color='#9400D3')
            )
        )
        grid = (
            Grid()
                .add(bar, grid_opts=opts.GridOpts(pos_left="24%"))
        )

        t.add(grid, "")
        t.add_schema(
            play_interval=duration * 1000,  # 轮播速度
            is_timeline_show=True,  # 是否显示 timeline 组件
            is_auto_play=False,  # 是否自动播放
        )

    t.render(html_path)

if __name__ == '__main__':
    plot(html_path='各省份每日确诊人数动态图.html', file='data/covid19_province_data.xlsx.xlsx', name_col='省级行政区', title='全国各省市新冠数据', duration=0.3)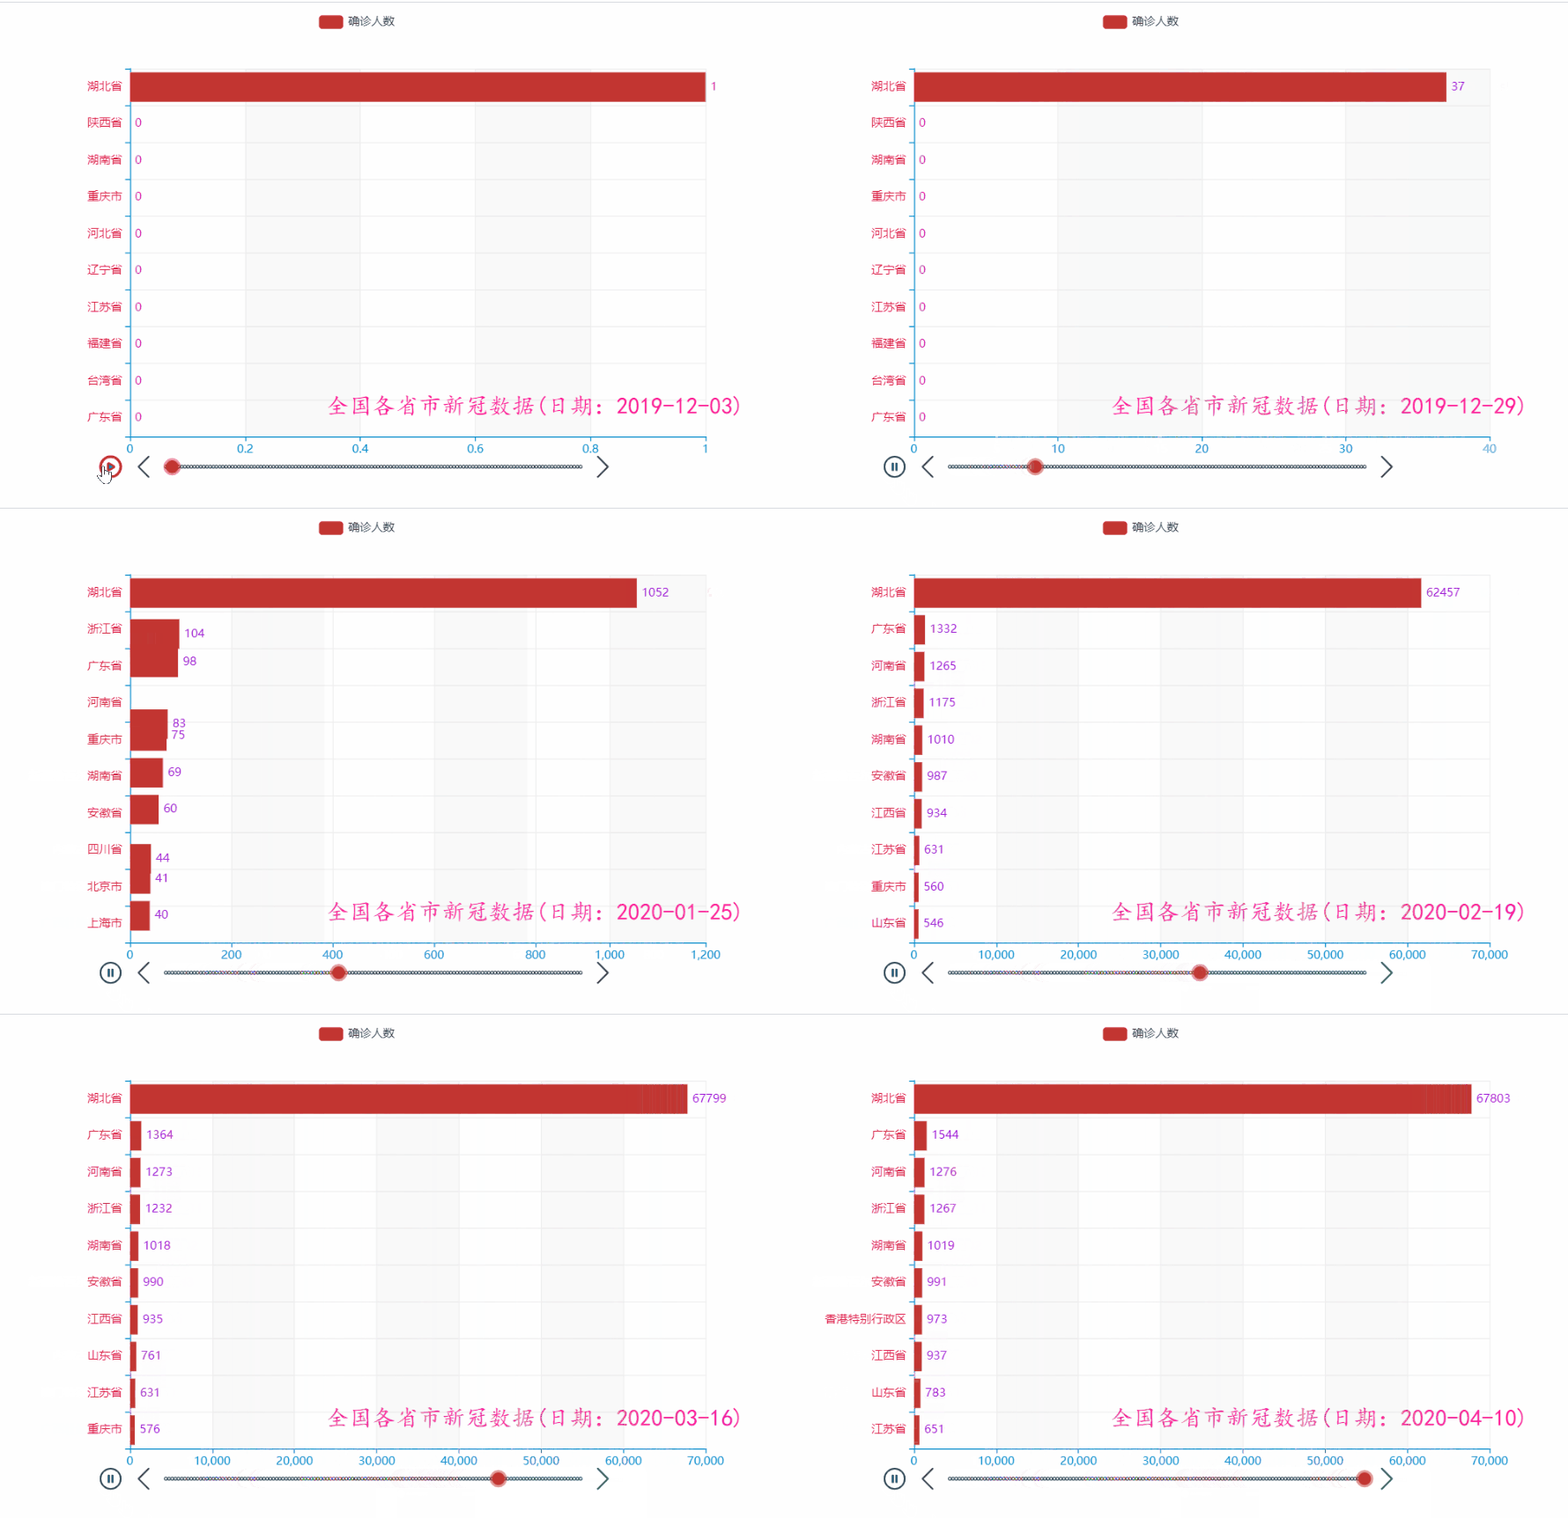
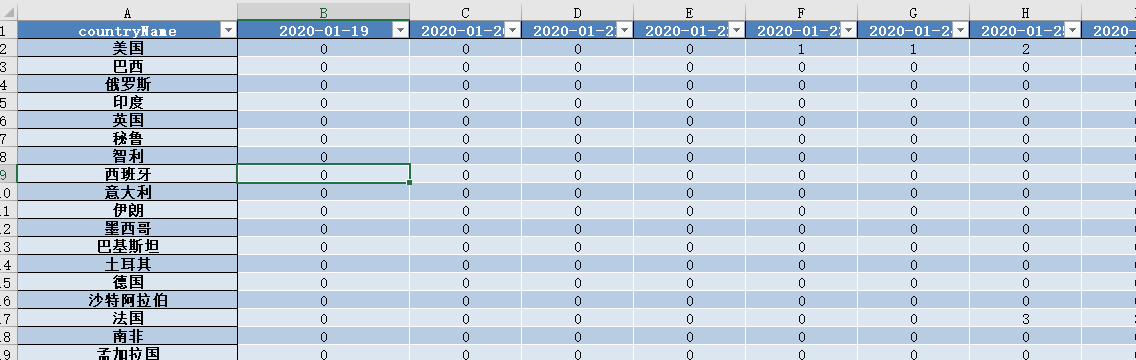
七、世界各国疫情数据动态图
数据
代码
import pandas as pd
from pyecharts import options as opts
from pyecharts.charts import Bar, Timeline, Grid
from pyecharts.globals import ThemeType, CurrentConfig

CurrentConfig.ONLINE_HOST = "https://cdn.kesci.com/lib/pyecharts_assets/"

def plot(file: str, name_col: str, title: str, num: int = 10, duration=1.0, html_path: str = 'render.html'):
    df = pd.read_excel(file, index_col=name_col)
    date_list = df.columns.to_list()

    t = Timeline(init_opts=opts.InitOpts(theme=ThemeType.MACARONS))  # 定制主题
    for date in date_list:
        data = df.sort_values(date, ascending=False)[:num][::-1]

        x = data.index.to_list()
        y = data[date].to_list()

        bar = (
            Bar()
                .add_xaxis(x)  # x轴数据
                .add_yaxis('确诊人数', y)  # y轴数据
                .reversal_axis()  # 翻转
                .set_global_opts(  # 全局配置项
                title_opts=opts.TitleOpts(  # 标题配置项
                    title=f'{title}(日期:{date})',
                    pos_right="5%", pos_bottom="15%",
                    title_textstyle_opts=opts.TextStyleOpts(
                        font_family='KaiTi', font_size=24, color='#FF1493'
                    )
                ),
                xaxis_opts=opts.AxisOpts(  # x轴配置项
                    splitline_opts=opts.SplitLineOpts(is_show=True),
                ),
                yaxis_opts=opts.AxisOpts(  # y轴配置项
                    splitline_opts=opts.SplitLineOpts(is_show=True),
                    axislabel_opts=opts.LabelOpts(color='#DC143C')
                )
            )
                .set_series_opts(  # 系列配置项
                label_opts=opts.LabelOpts(  # 标签配置
                    position="right", color='#9400D3')
            )
        )
        grid = (
            Grid()
                .add(bar, grid_opts=opts.GridOpts(pos_left="24%"))
        )

        t.add(grid, "")
        t.add_schema(
            play_interval=duration * 1000,  # 轮播速度
            is_timeline_show=True,  # 是否显示 timeline 组件
            is_auto_play=False,  # 是否自动播放
        )

    t.render(html_path)


if __name__ == '__main__':
    plot(html_path='世界各国新冠疫情数据动态图.html', file='data/covid19_country_data.xlsx', name_col='countryName', title='世界各国新冠数据', duration=0.3)