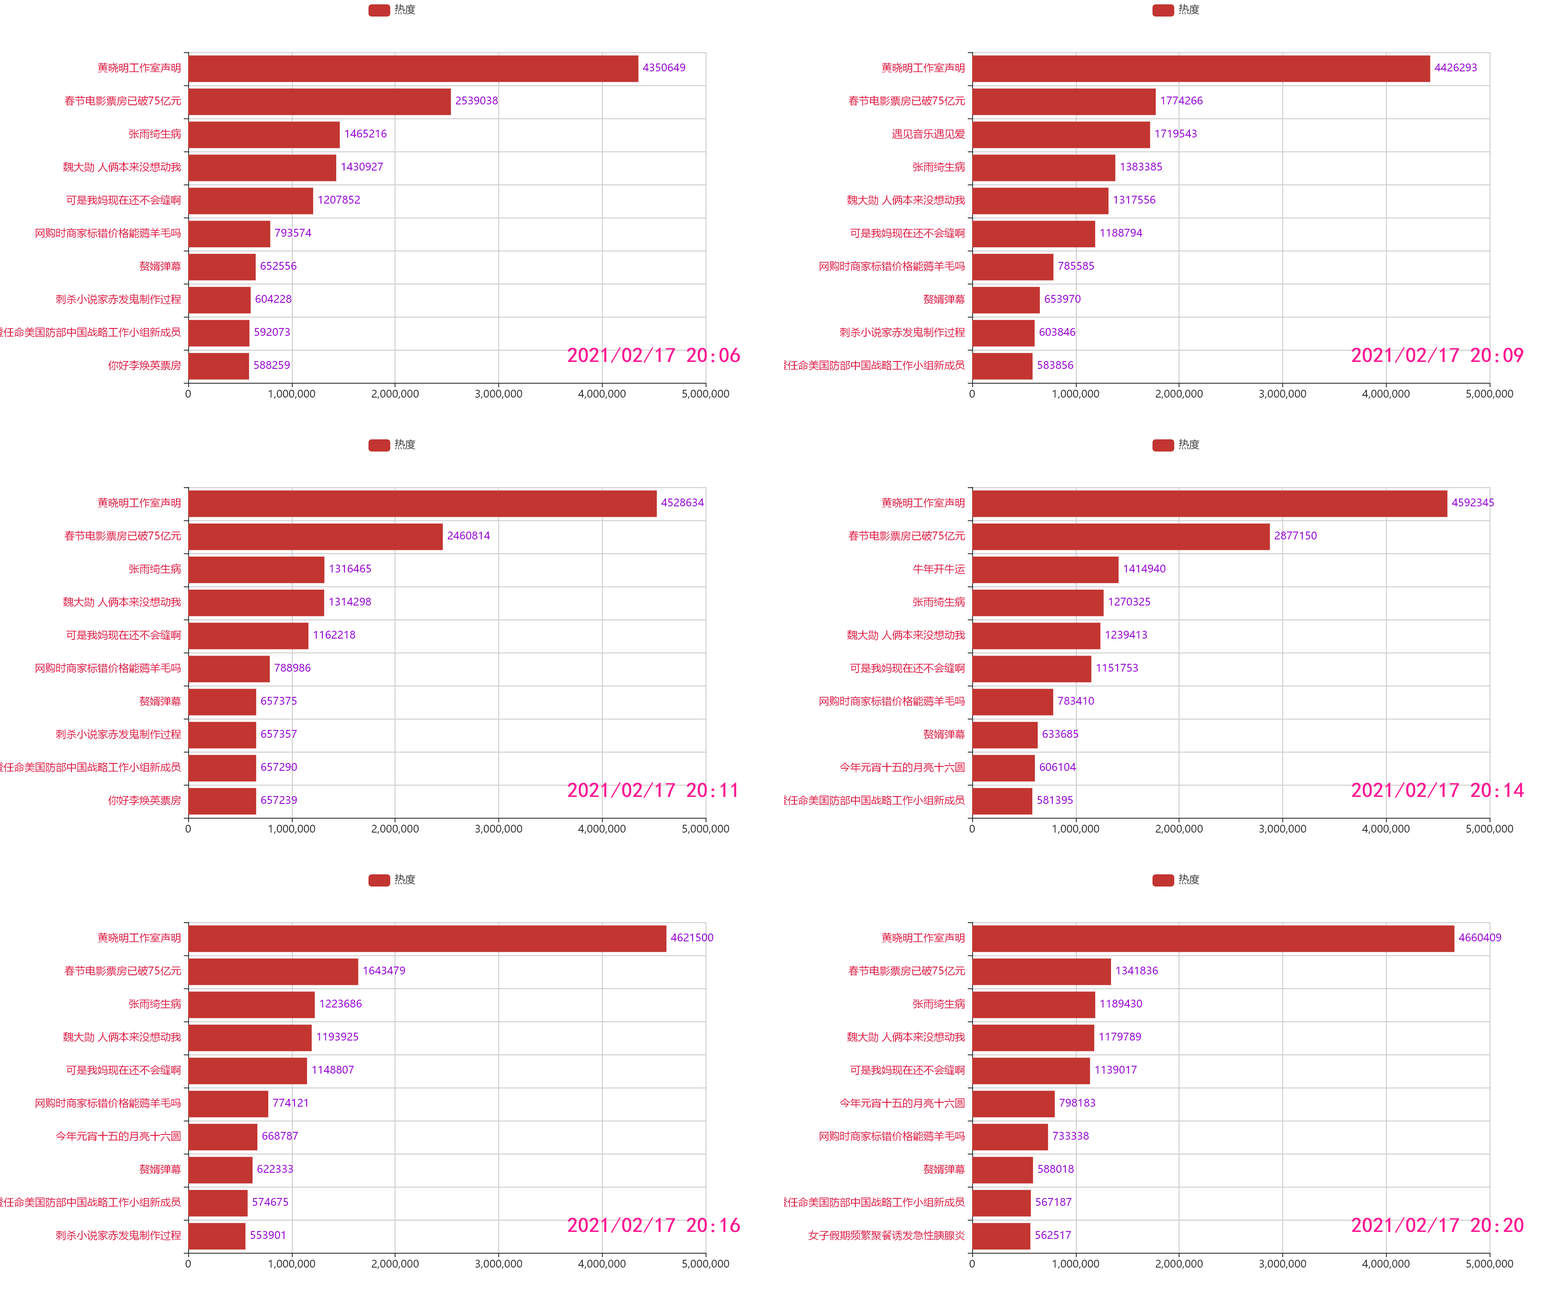
本项目源码已上传至gitee: 项目地址
一、schedule模块定时执行任务
python中有一个轻量级的定时任务调度的库:schedule。他可以完成每分钟,每小时,每天,周几,特定日期的定时任务。因此十分方便我们执行一些轻量级的定时任务。
- 安装
pip install -i https://pypi.tuna.tsinghua.edu.cn/simple schedule
代码示例
import schedule
import time

def run():
    print("I'm doing something...")

schedule.every(10).minutes.do(run)    # 每隔十分钟执行一次任务
schedule.every().hour.do(run)         # 每隔一小时执行一次任务
schedule.every().day.at("10:30").do(run)  # 每天的10:30执行一次任务
schedule.every().monday.do(run)  # 每周一的这个时候执行一次任务
schedule.every().wednesday.at("13:15").do(run) # 每周三13:15执行一次任务

while True:
    schedule.run_pending()  # run_pending:运行所有可以运行的任务
二、爬取微博热搜内容
微博热搜网址为:
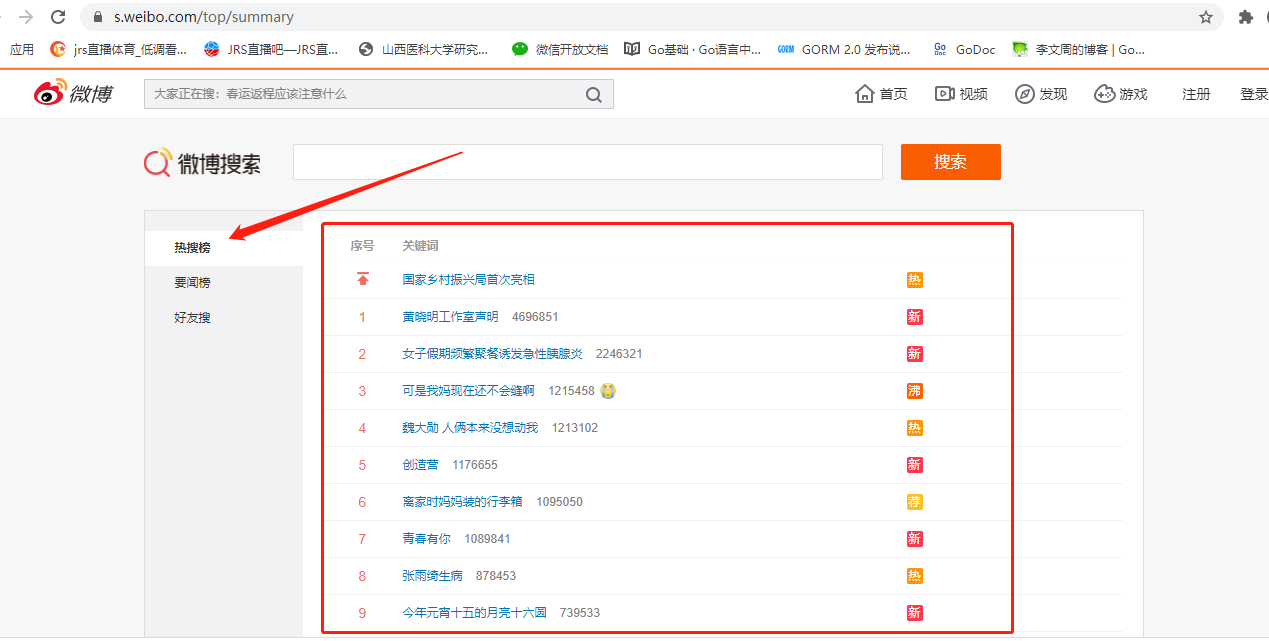
代码
import logging
from datetime import datetime
import pandas as pd
import schedule
import os

logging.basicConfig(level=logging.INFO, format='%(asctime)s - %(levelname)s: %(message)s')


def get_content(to_file):
    logging.info('start downloading weibo hot data...')
    url = 'https://s.weibo.com/top/summary'
    df = pd.read_html(url)[0][1:11][['序号', '关键词']]  # 获取热搜前10
    time_ = datetime.now().strftime("%Y/%m/%d %H:%M")  # 获取当前时间
    df['序号'] = df['序号'].apply(int)
    df['热度'] = df['关键词'].str.split('  ', expand=True)[1]
    df['关键词'] = df['关键词'].str.split('  ', expand=True)[0]
    df['时间'] = [time_] * len(df['序号'])
    if not os.path.exists(to_file):
        df.to_csv(to_file, mode='a+', index=False)
    else:
        df.to_csv(to_file, mode='w', index=False, header=False)
    logging.info('weibo hot data downloaded, saved to data/weibo_hot.csv...')


# 定时爬虫
schedule.every(1).minutes.do(get_content, ('data/weibo_hot.csv', ))

while True:
    schedule.run_pending()
运行
2021-02-17 20:06:08,101 - INFO: start downloading weibo hot data...
2021-02-17 20:06:19,246 - INFO: weibo hot data downloaded, saved to data/weibo_hot.csv...
2021-02-17 20:07:19,248 - INFO: start downloading weibo hot data...
2021-02-17 20:07:20,069 - INFO: weibo hot data downloaded, saved to data/weibo_hot.csv...
2021-02-17 20:08:20,070 - INFO: start downloading weibo hot data...
2021-02-17 20:08:26,476 - INFO: weibo hot data downloaded, saved to data/weibo_hot.csv...
2021-02-17 20:09:26,477 - INFO: start downloading weibo hot data...
2021-02-17 20:09:31,469 - INFO: weibo hot data downloaded, saved to data/weibo_hot.csv...
...
微博热搜设置每1分钟爬取一次,给代码加个定时器。让程序跑一会儿,微博热搜变动数据就保存到了CSV文件里。
三、pyecharts动态可视化
环境搭建
pip install pyecharts snapshot-selenium
pyecharts-assets 提供了 pyecharts 的静态资源文件。
# 通过 git clone
$ git clone https://github.com/pyecharts/pyecharts-assets.git

# 或者直接下载压缩包
$ wget https://github.com/pyecharts/pyecharts-assets/archive/master.zip
notebook安装扩展
$ cd pyecharts-assets
# 安装并激活插件
$ jupyter nbextension install assets
$ jupyter nbextension enable assets/mainpyecharts默认输出html,若要保存图片,需要安装ChromeDriver:下载地址
1 基本时间轮播图
import os

import imageio
from pyecharts import options as opts
from pyecharts.charts import Bar, Timeline
from pyecharts.faker import Faker
from pyecharts.globals import CurrentConfig, ThemeType
# 导入输出图片工具
from pyecharts.render import make_snapshot
# 使用snapshot-selenium 渲染图片
from snapshot_selenium import snapshot

CurrentConfig.ONLINE_HOST = 'F:\python37\pyecharts-assets/assets/'


def create_gif(image_list, gif_path, duration=1.0):
    """
    :param image_list: 这个列表用于存放生成动图的图片
    :param gif_path: 字符串,所生成gif文件名,带.gif后缀
    :param duration: 图像间隔时间
    :return:
    """
    frames = []
    for image_name in image_list:
        frames.append(imageio.imread(image_name))

    imageio.mimsave(gif_path, frames, 'GIF', duration=duration)


def plot1(out_type: str = 'html', html_path: str = None,  images_dir: str = 'images', gif_path: str = None, duration = 1):
    xaxis_data = Faker.choose()
    if out_type == 'html' and html_path:
        tl = Timeline(init_opts=opts.InitOpts(theme=ThemeType.LIGHT))
        for i in range(2015, 2021):
            bar = (
                Bar()
                    .add_xaxis(xaxis_data)
                    .add_yaxis("商家A", Faker.values())
                    .add_yaxis("商家B", Faker.values())
                    .set_global_opts(title_opts=opts.TitleOpts("商店{}年商品销售额".format(i)))
            )
            tl.add(bar, "{}年".format(i))
        # 输出html
        tl.render(html_path)
        print('')
    elif out_type == 'gif' and gif_path:
        image_list = []
        for i in range(2015, 2021):
            bar = (
                Bar(init_opts=opts.InitOpts(bg_color='white'))
                    .add_xaxis(xaxis_data)
                    .add_yaxis("商家A", Faker.values())
                    .add_yaxis("商家B", Faker.values())
                    .set_global_opts(title_opts=opts.TitleOpts("商店{}年商品销售额".format(i)))
            )
            make_snapshot(snapshot, bar.render(), f"{images_dir}/{i}年.png")
            image_list.append(f'{images_dir}/{i}年.png')
            print(f'{images_dir}{i}年.png 保存成功.')
        create_gif(image_list, gif_path, duration)
        print(f'{gif_path} 完成创建.')


if __name__ == '__main__':
    plot1(html_path='timeline_bar.html')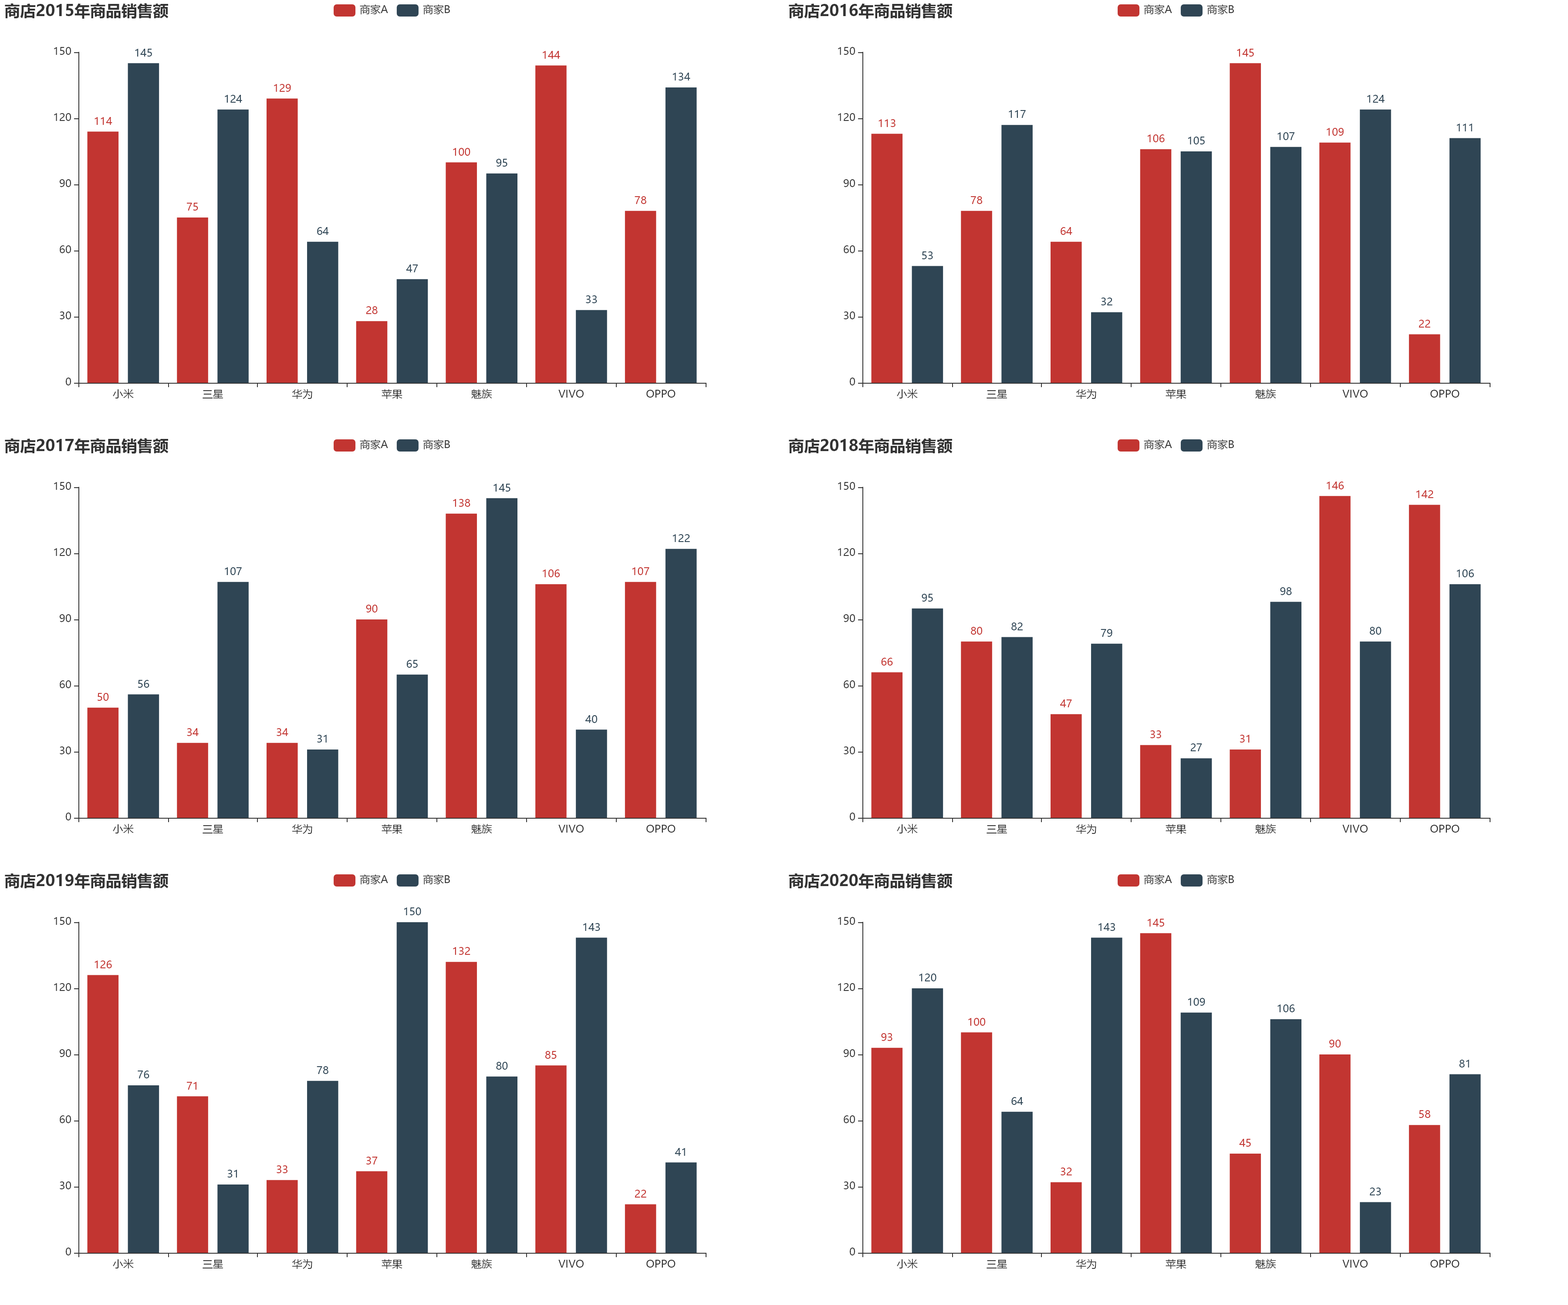
横向条形图
def plot2(out_type: str = 'html', html_path: str = None, images_dir: str = 'images', gif_path: str = None, duration = 1):
    xaxis_data = Faker.choose()
    if out_type == 'html' and html_path:
        tl = Timeline(init_opts=opts.InitOpts(theme=ThemeType.LIGHT))
        for i in range(2015, 2021):
            bar = (
                Bar()
                    .add_xaxis(xaxis_data)
                    .add_yaxis("商家A", Faker.values(), label_opts=opts.LabelOpts(position="right"))
                    .add_yaxis("商家B", Faker.values(), label_opts=opts.LabelOpts(position="right"))
                    .reversal_axis()
                    .set_global_opts(
                    title_opts=opts.TitleOpts("Timeline-Bar-Reversal (时间: {} 年)".format(i))
                )
            )
            tl.add(bar, "{}年".format(i))
        # 输出html
        tl.render(html_path)
        print('')
    elif out_type == 'gif' and gif_path:
        image_list = []
        for i in range(2015, 2021):
            bar = (
                Bar(init_opts=opts.InitOpts(bg_color='white'))
                    .add_xaxis(xaxis_data)
                    .add_yaxis("商家A", Faker.values(), label_opts=opts.LabelOpts(position="right"))
                    .add_yaxis("商家B", Faker.values(), label_opts=opts.LabelOpts(position="right"))
                    .reversal_axis()
                    .set_global_opts(
                    title_opts=opts.TitleOpts("Timeline-Bar-Reversal (时间: {} 年)".format(i))
                )
            )
            make_snapshot(snapshot, bar.render(), f"{images_dir}/{i}年.png")
            image_list.append(f'{images_dir}/{i}年.png')
            print(f'{images_dir}{i}年.png 保存成功.')
        create_gif(image_list, gif_path, duration)
        print(f'{gif_path} 完成创建.')


if __name__ == '__main__':
    plot2(html_path='timeline_bar_reversal.html')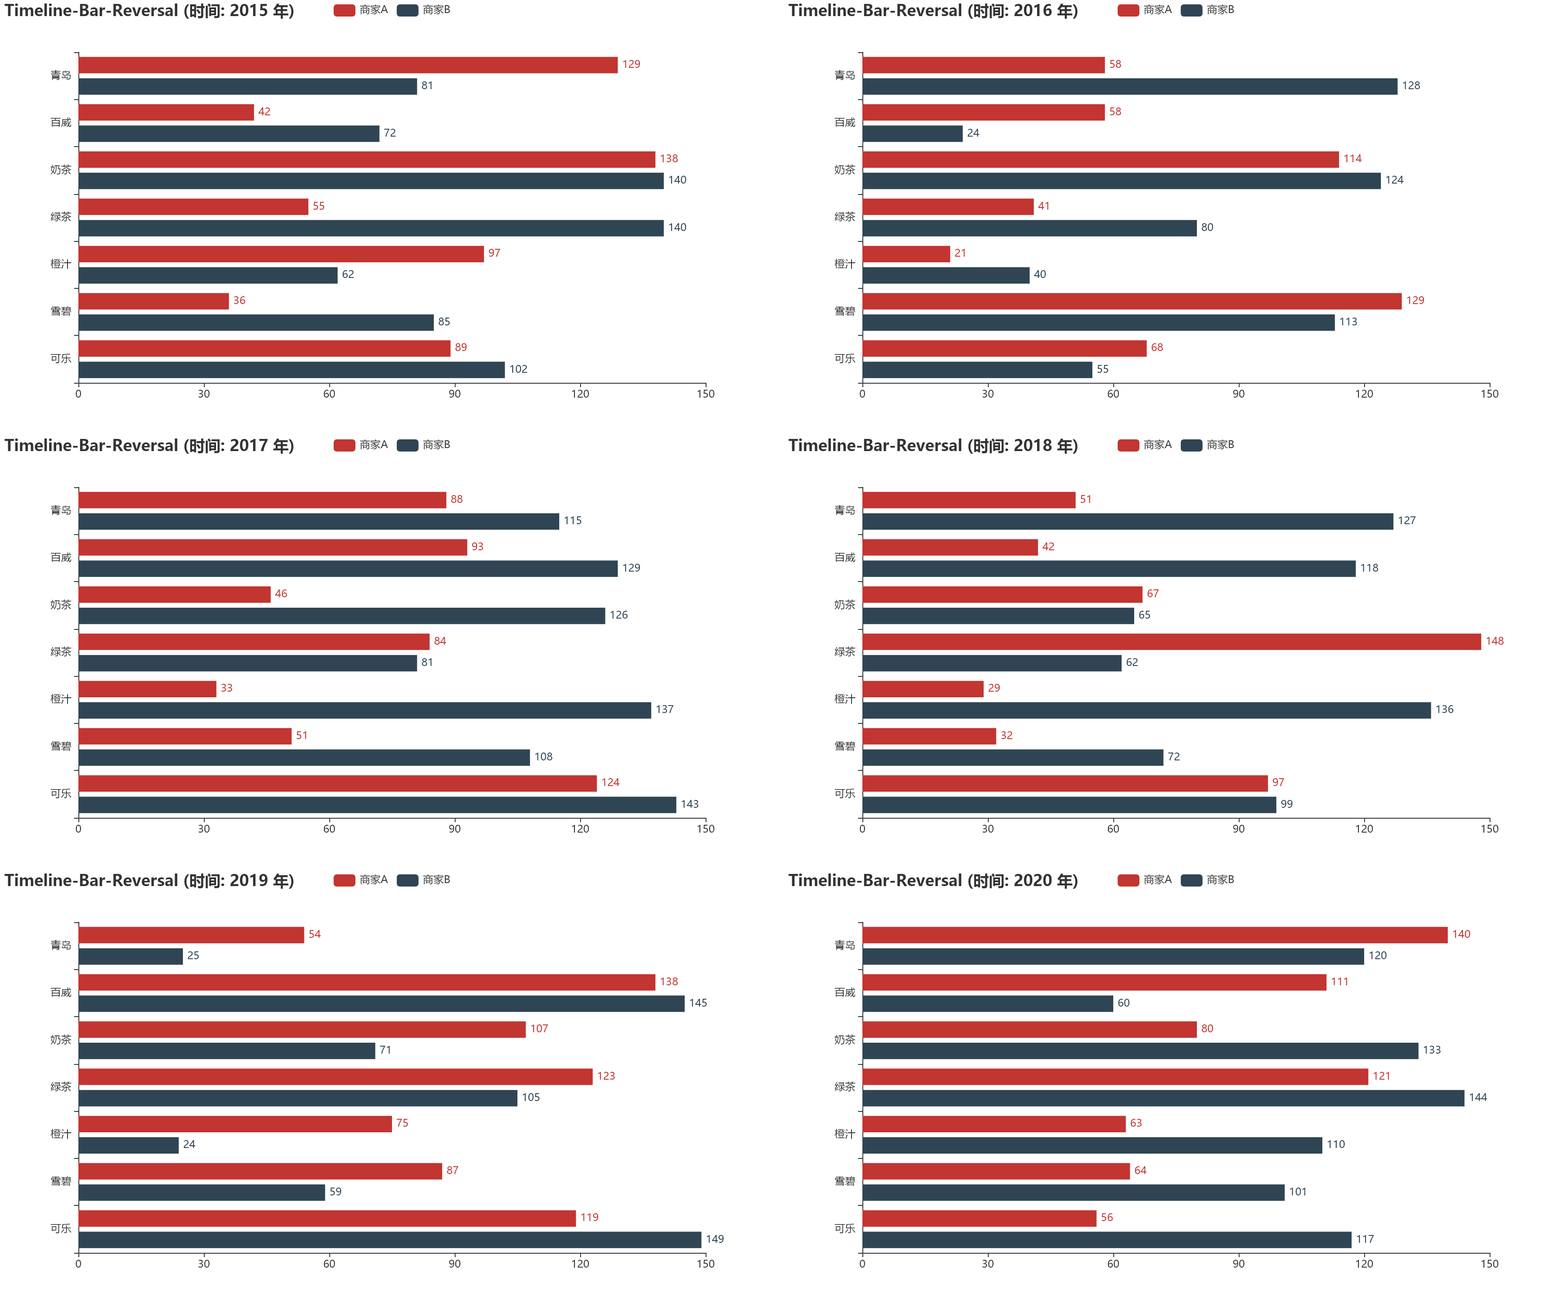
2 微博热搜动态图
# -*- coding: utf-8 -*-

"""
DateTime   : 2021/02/17 20:09
Author     : ZhangYafei
Description:
"""
import os

import imageio
import pandas as pd
from pyecharts import options as opts
from pyecharts.charts import Bar, Timeline, Grid
from pyecharts.globals import ThemeType, CurrentConfig
# 导入输出图片工具
from pyecharts.render import make_snapshot
# 使用snapshot-selenium 渲染图片
from snapshot_selenium import snapshot


CurrentConfig.ONLINE_HOST = 'F:\python37\pyecharts-assets/assets/'


def create_gif(image_list, gif_path, duration=1.0):
    """
    :param image_list: 这个列表用于存放生成动图的图片
    :param gif_path: 字符串,所生成gif文件名,带.gif后缀
    :param duration: 图像间隔时间
    :return:
    """
    frames = []
    for image_name in image_list:
        frames.append(imageio.imread(image_name))

    imageio.mimsave(gif_path, frames, 'GIF', duration=duration)


def plot(out_type: str = 'html', html_path: str = None, images_dir: str = 'images', gif_path: str = None, duration=1):
    df = pd.read_csv('data/weibo_hot.csv')
    if out_type == 'html' and html_path:
        t = Timeline(init_opts=opts.InitOpts(theme=ThemeType.MACARONS))  # 定制主题
        for i in range(df.shape[0] // 10):
            bar = (
                Bar()
                    .add_xaxis(list(df['关键词'][i * 10: i * 10 + 10][::-1]))  # x轴数据
                    .add_yaxis('热度', list(df['热度'][i * 10: i * 10 + 10][::-1]))  # y轴数据
                    .reversal_axis()  # 翻转
                    .set_global_opts(  # 全局配置项
                    title_opts=opts.TitleOpts(  # 标题配置项
                        title=f"{list(df['时间'])[i * 10]}",
                        pos_right="5%", pos_bottom="15%",
                        title_textstyle_opts=opts.TextStyleOpts(
                            font_family='KaiTi', font_size=24, color='#FF1493'
                        )
                    ),
                    xaxis_opts=opts.AxisOpts(  # x轴配置项
                        splitline_opts=opts.SplitLineOpts(is_show=True),
                    ),
                    yaxis_opts=opts.AxisOpts(  # y轴配置项
                        splitline_opts=opts.SplitLineOpts(is_show=True),
                        axislabel_opts=opts.LabelOpts(color='#DC143C')
                    )
                )
                    .set_series_opts(  # 系列配置项
                    label_opts=opts.LabelOpts(  # 标签配置
                        position="right", color='#9400D3')
                )
            )
            grid = (
                Grid()
                    .add(bar, grid_opts=opts.GridOpts(pos_left="24%"))
            )
            t.add(grid, "")
            t.add_schema(
                play_interval=100,  # 轮播速度
                is_timeline_show=False,  # 是否显示 timeline 组件
                is_auto_play=True,  # 是否自动播放
            )

        t.render(html_path)
    elif out_type == 'gif' and images_dir:
        image_list = []
        for i in range(df.shape[0] // 10):
            title = f"{list(df['时间'])[i * 10]}"
            bar = (
                Bar(init_opts=opts.InitOpts(bg_color='white'))
                    .add_xaxis(list(df['关键词'][i * 10: i * 10 + 10][::-1]))  # x轴数据
                    .add_yaxis('热度', list(df['热度'][i * 10: i * 10 + 10][::-1]))  # y轴数据
                    .reversal_axis()  # 翻转
                    .set_global_opts(  # 全局配置项
                    title_opts=opts.TitleOpts(  # 标题配置项
                        title=title,
                        pos_right="5%", pos_bottom="15%",
                        title_textstyle_opts=opts.TextStyleOpts(
                            font_family='KaiTi', font_size=24, color='#FF1493'
                        )
                    ),
                    xaxis_opts=opts.AxisOpts(  # x轴配置项
                        splitline_opts=opts.SplitLineOpts(is_show=True),
                    ),
                    yaxis_opts=opts.AxisOpts(  # y轴配置项
                        splitline_opts=opts.SplitLineOpts(is_show=True),
                        axislabel_opts=opts.LabelOpts(color='#DC143C')
                    )
                )
                    .set_series_opts(  # 系列配置项
                    label_opts=opts.LabelOpts(  # 标签配置
                        position="right", color='#9400D3')
                )
            )
            grid = (
                Grid(init_opts=opts.InitOpts(bg_color='white'))
                    .add(bar, grid_opts=opts.GridOpts(pos_left="24%"))
            )
            make_snapshot(snapshot, grid.render(), f"{images_dir}/{i}.png")
            image_list.append(f"{images_dir}/{i}.png")
            print(f'{images_dir}{i}.png 保存成功.')
        create_gif(image_list, gif_path, duration)
        print(f'{gif_path} 完成创建.')


if __name__ == '__main__':
    plot(html_path='微博热搜动态图.html')
    # plot(out_type='gif', gif_path='微博热搜动态图.gif', duration=1)