看 PyEcharts 名字就猜得到,PyEcharts = Python + Echarts。Echarts 是一个由百度开源的数据可视化工具,凭借着良好的交互性,精巧的图表设计,得到了众多开发者的认可,而 Python 就不用多说了。当 Python 遇到了 Echarts,就变成了 PyEcharts。
一、快速开始
安装
pip install pyecharts查看版本
import pyecharts

pyecharts.__version__
快速上手
生成HTML
from pyecharts.charts import Bar

bar = Bar()
bar.add_xaxis(["衬衫", "羊毛衫", "雪纺衫", "裤子", "高跟鞋", "袜子"])
bar.add_yaxis("商家A", [5, 20, 36, 10, 75, 90])
# render 会生成本地 HTML 文件,默认会在当前目录生成 render.html 文件
# 也可以传入路径参数,如 bar.render("mycharts.html")
bar.render()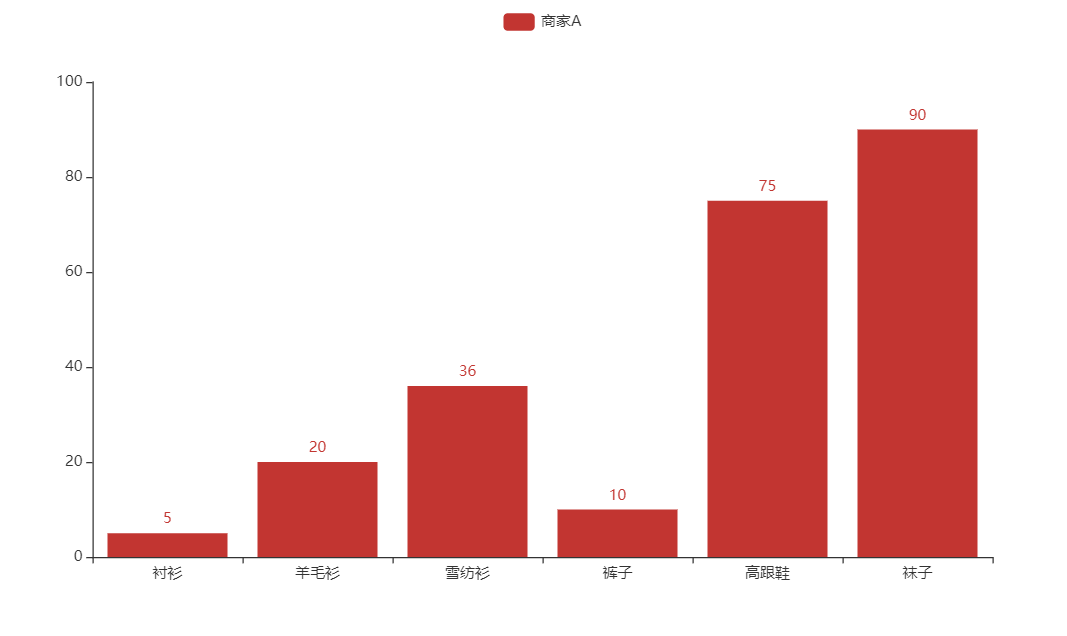
pyecharts 所有方法均支持链式调用。
from pyecharts.charts import Bar

bar = (
    Bar()
    .add_xaxis(["衬衫", "羊毛衫", "雪纺衫", "裤子", "高跟鞋", "袜子"])
    .add_yaxis("商家A", [5, 20, 36, 10, 75, 90])
)
bar.render()
使用 options 配置项,在 pyecharts 中,一切皆 Options。
from pyecharts.charts import Bar
from pyecharts import options as opts

# V1 版本开始支持链式调用
# 你所看到的格式其实是 `black` 格式化以后的效果
# 可以执行 `pip install black` 下载使用
bar = (
    Bar()
    .add_xaxis(["衬衫", "羊毛衫", "雪纺衫", "裤子", "高跟鞋", "袜子"])
    .add_yaxis("商家A", [5, 20, 36, 10, 75, 90])
    .set_global_opts(title_opts=opts.TitleOpts(title="主标题", subtitle="副标题"))
    # 或者直接使用字典参数
    # .set_global_opts(title_opts={"text": "主标题", "subtext": "副标题"})
)
bar.render()

# 不习惯链式调用的开发者依旧可以单独调用方法
bar = Bar()
bar.add_xaxis(["衬衫", "羊毛衫", "雪纺衫", "裤子", "高跟鞋", "袜子"])
bar.add_yaxis("商家A", [5, 20, 36, 10, 75, 90])
bar.set_global_opts(title_opts=opts.TitleOpts(title="主标题", subtitle="副标题"))
bar.render()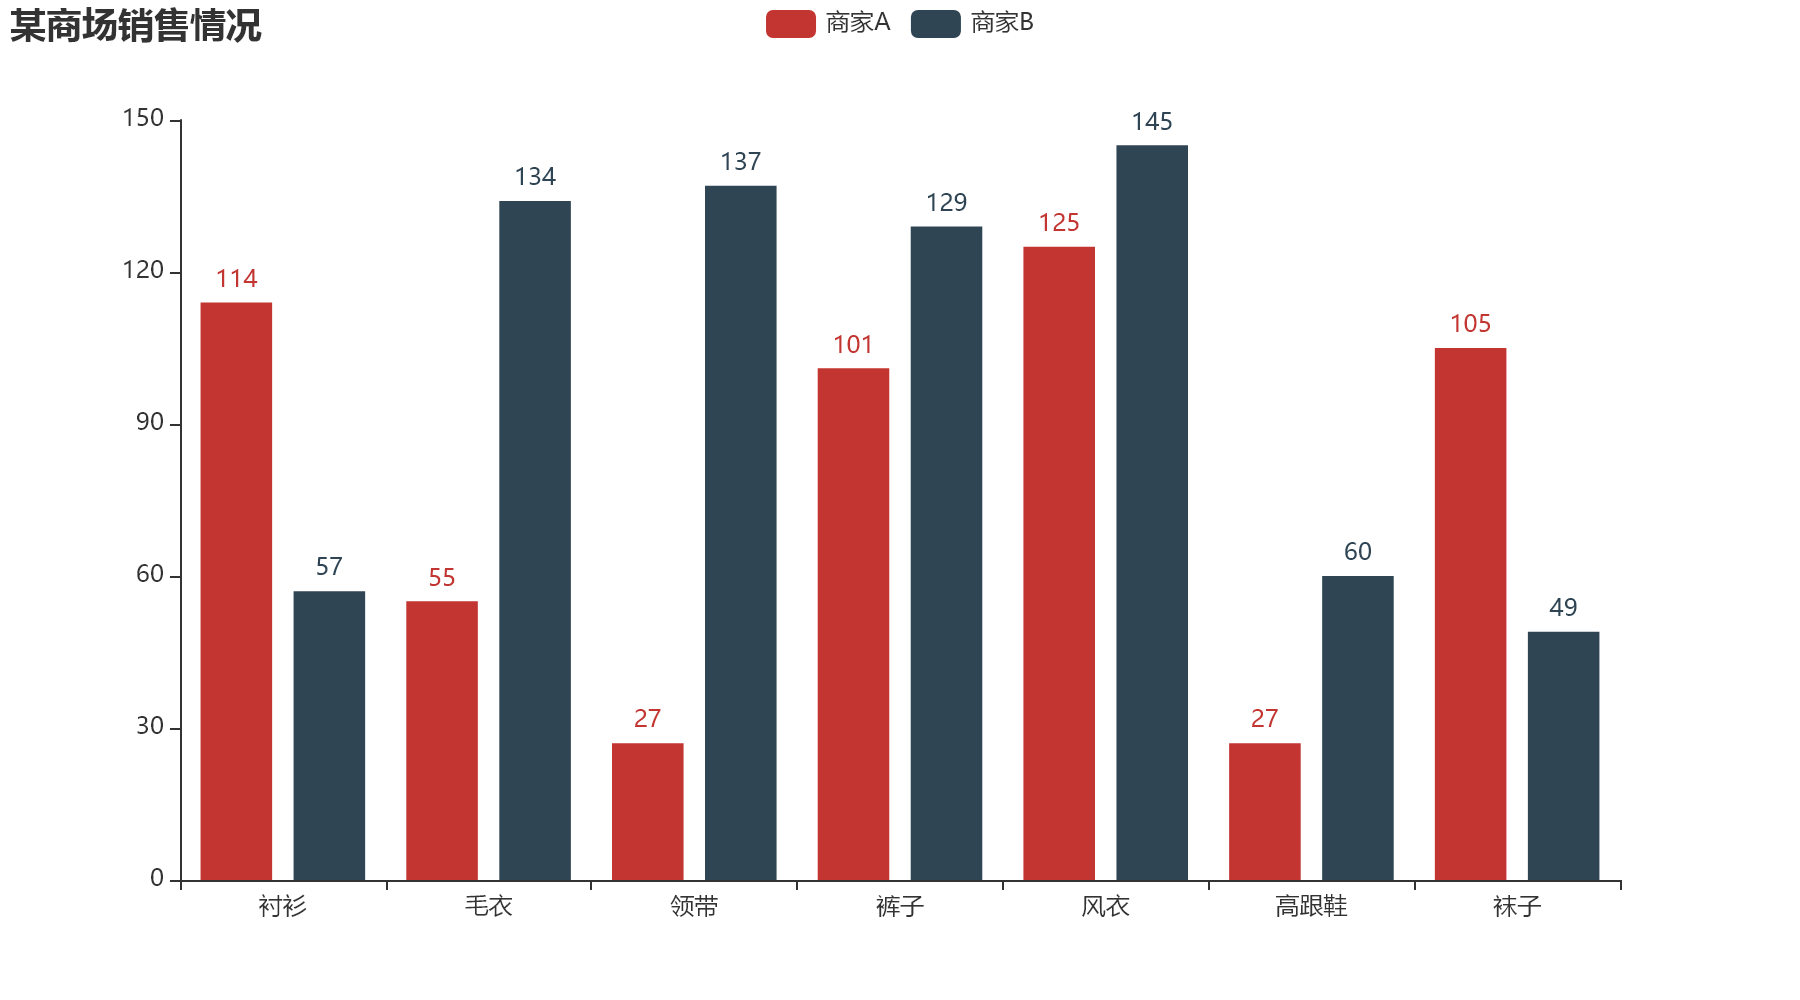
生成图片
pip install snapshot-seleniumpyecharts默认输出html,若要保存图片,需要安装ChromeDriver:下载地址,下载之后放到系统环境目录。
from snapshot_selenium import snapshot as driver

from pyecharts import options as opts
from pyecharts.charts import Bar
from pyecharts.render import make_snapshot


def bar_chart() -> Bar:
    c = (
        Bar()
        .add_xaxis(["衬衫", "毛衣", "领带", "裤子", "风衣", "高跟鞋", "袜子"])
        .add_yaxis("商家A", [114, 55, 27, 101, 125, 27, 105])
        .add_yaxis("商家B", [57, 134, 137, 129, 145, 60, 49])
        .reversal_axis()
        .set_series_opts(label_opts=opts.LabelOpts(position="right"))
        .set_global_opts(title_opts=opts.TitleOpts(title="Bar-测试渲染图片"))
    )
    return c

# 需要安装 snapshot-selenium 或者 snapshot-phantomjs
make_snapshot(driver, bar_chart().render(), "bar.png")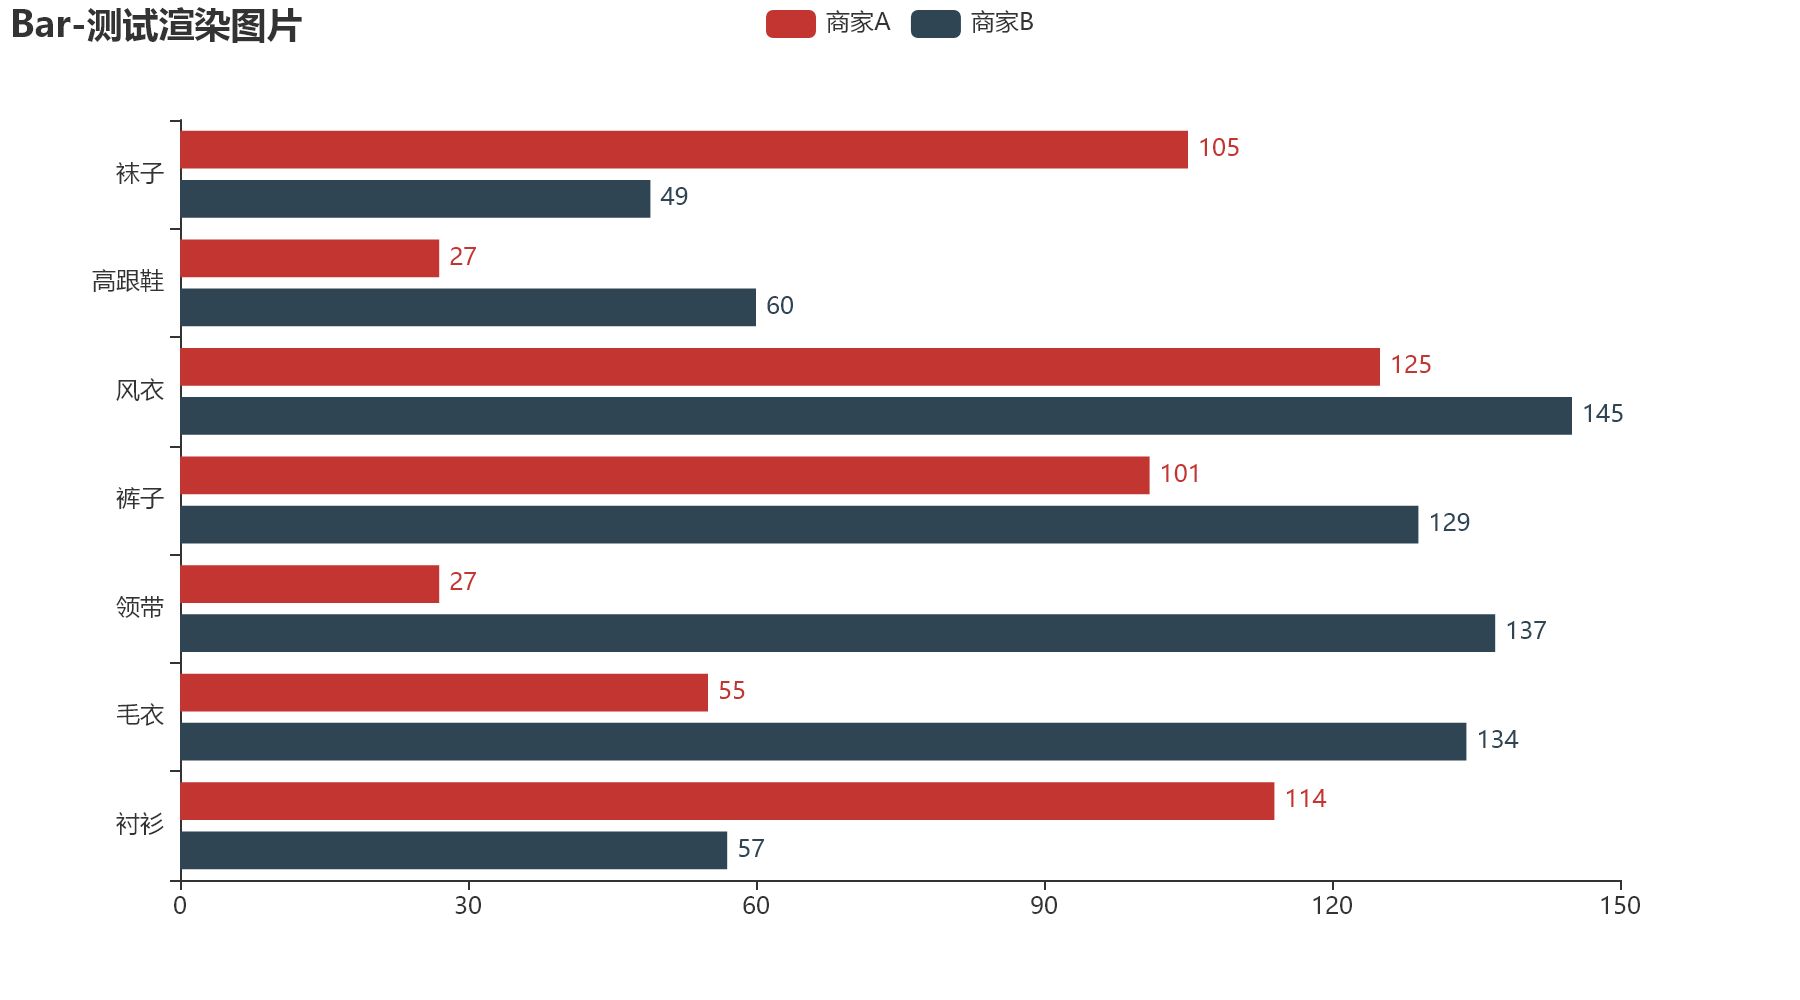
使用主题
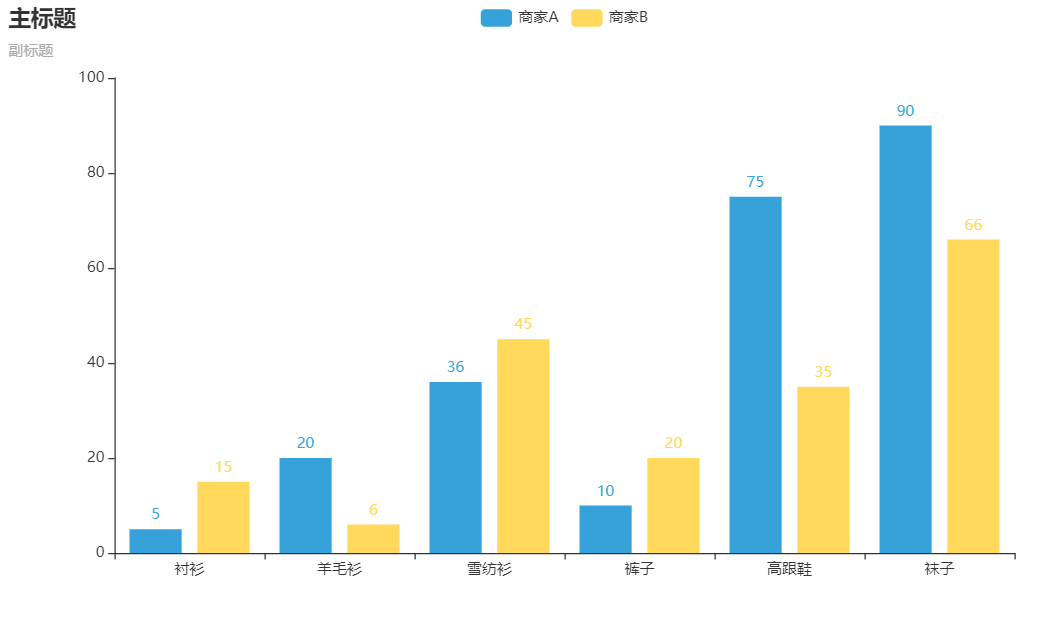
pyecharts 提供了 10+ 种内置主题,开发者也可以定制自己喜欢的主题,进阶话题-定制主题 有相关介绍。
from pyecharts.charts import Bar
from pyecharts import options as opts
# 内置主题类型可查看 pyecharts.globals.ThemeType
from pyecharts.globals import ThemeType

bar = (
    Bar(init_opts=opts.InitOpts(theme=ThemeType.LIGHT))
    .add_xaxis(["衬衫", "羊毛衫", "雪纺衫", "裤子", "高跟鞋", "袜子"])
    .add_yaxis("商家A", [5, 20, 36, 10, 75, 90])
    .add_yaxis("商家B", [15, 6, 45, 20, 35, 66])
    .set_global_opts(title_opts=opts.TitleOpts(title="主标题", subtitle="副标题"))
)
Note: 在使用 Pandas&Numpy 时,请确保将数值类型转换为 python 原生的 int/float。比如整数类型请确保为 int,而不是 numpy.int32
二、其他
教程推荐: